This page is the one home for money on this site. District numbers and our estimates are always labeled separately. Shorter versions: Board brief (one page) and The Story. Longer material is under the + headings.
The district's numbers
The district’s own annual cost of the K–8 Chinese programs, beyond a traditional classroom, is $1,257,600, about $2,730 per student for the 460 students enrolled this fall. 1
By the district’s own estimates, ending elementary and middle-school Chinese and keeping only high-school Chinese (the option selected) is listed at “an estimated $1.23 million in savings” (the document does not label it first-year); a Chinese “special” class families could choose, with middle-school Chinese Language Arts phased out, was estimated to save $1 million in the first year; a sunset (the district does not say which students finish) saves about $360,000 in the first year. The difference, about $870,000, is our subtraction of the two printed figures if both are first-year (the $360,000 is labeled first-year; the $1.23 million is not), and it would shrink each year as classes finish. 1
The $1.08 million staffing line is the cost that “would not be incurred” if all program students attended their home schools. 1 Page 89 says students may stay and “the full financial impact may not be realized immediately,” and that combining classrooms can still save positions. 1 KCTV5 reported the superintendent said that if parents choose to stay at their current schools, staffing would remain the same. 2 The document does not show which scenario produces the $1.23 million.
What each option costs, year by year
Sunsetting means every current student finishes and there is no new kindergarten class. Continuing the full program means the program goes on, including new kindergarten classes. The first table is our estimate. Below it, a collapsed illustration carries the district's year-one figures forward; it is not validated and is kept separate from our estimate.
Our estimate
Our estimate (preliminary parent-model estimates under review; the base estimate assumes 50% of immersion students stay at their current school). Extra cost compared with ending the program after 2026–27, in today's (2026–27) dollars. Per student is that year's cost divided by students in the program; the 8-year figure is the total divided by student-years. Totals calculated before rounding. In constant 2026–27 dollars; keeping the program serves more cohorts and continues beyond the eight-year window. Sunsetting falls every year and ends after 2034–35; continuing the full program grows and goes on after 2034–35.
| School year | Sunsetting (per student) | Added cost to continue full program | Continue full program, total (per student) |
|---|---|---|---|
| 2027–28 | $707,300 ($1,861) | +$56,200 | $763,500 ($1,792) |
| 2028–29 | $554,700 ($1,813) | +$112,000 | $666,700 ($1,684) |
| 2029–30 | $485,600 ($2,075) | +$167,400 | $653,000 ($1,784) |
| 2030–31 | $357,000 ($2,017) | +$268,000 | $625,000 ($1,796) |
| 2031–32 | $229,600 ($1,897) | +$368,200 | $597,800 ($1,817) |
| 2032–33 | $54,700 ($659) | +$543,300 | $598,000 ($1,829) |
| 2033–34 | $41,800 ($773) | +$571,300 | $613,100 ($1,852) |
| 2034–35 | $13,400 ($447) | +$599,700 | $613,100 ($1,814) |
| 8-year total | $2,444,100 ($1,765) | +$2,686,000 | $5,130,100 ($1,793) |
Illustration: the district's year-one figures carried forward
Illustration, not validated: year 1 is our reading of the district's figures (p. 93; the $870,000 is our subtraction, if both figures are first-year); later years follow our model's year-to-year pattern. No district worksheet supports either. Continue full program = the $1.23 million the district's plan saves (not labeled by year); sunsetting = $1.23 million minus the $360,000 a sunset saves, about $870,000. The district has not published later years, so each later year rises or falls by the same percentage as our estimate. Per student divides by our enrollment projections, because the district has not published next year's enrollment. Totals calculated before rounding. Today's dollars.
| School year | Sunsetting (per student) | Added cost to continue full program | Continue full program, total (per student) |
|---|---|---|---|
| 2027–28 | $870,000 ($2,289) | +$360,000 | $1,230,000 ($2,887) |
| 2028–29 | $682,300 ($2,230) | +$391,800 | $1,074,100 ($2,712) |
| 2029–30 | $597,300 ($2,553) | +$454,800 | $1,052,100 ($2,874) |
| 2030–31 | $439,100 ($2,481) | +$567,800 | $1,006,900 ($2,893) |
| 2031–32 | $282,400 ($2,334) | +$680,700 | $963,100 ($2,927) |
| 2032–33 | $67,300 ($811) | +$896,100 | $963,400 ($2,946) |
| 2033–34 | $51,400 ($951) | +$936,400 | $987,800 ($2,984) |
| 2034–35 | $16,500 ($550) | +$971,200 | $987,700 ($2,922) |
| 8-year total | $3,006,300 ($2,171) | +$5,258,800 | $8,265,100 ($2,889) |
Close to the district's number; the gap reflects our assumptions
The district's $1,080,000 staffing line assumes every immersion student attends their home school and counts the net classrooms that would close on both the Chinese and English sides (pp. 24–29, 88). Using the district's 2022 classroom method, our model comes within about 1% of the district's staffing figure for this year: about $1,068,700 against $1,080,000. We can't verify that this is how the district calculated its current figure. The difference reflects our placement and staffing assumptions. Applied to next year's classes (2027–28), the same method gives about 10.4 position equivalents and about $1,121,600 in total. The $1.12 million figure is our extrapolation of the district's historical worksheet, not a verified district estimate for next year. So the gap between that figure and our $763,500 base estimate for the same year, about $358,000, is not simply a disagreement about arithmetic. It comes mainly from two linked inputs: how many immersion students stay, and how many teaching positions that leaves the district able to cut (the district also counts closures on both the Chinese and English sides). 1
Same program, same cost formulas; each row changes how many immersion students stay at their current school and, with it, how many teaching positions can be cut. The first row also uses the district’s both-sides net-classroom method. 2027–28, continuing the full program, today’s dollars; preliminary parent-model figures, rounded to the nearest $100. The extra cost under each assumption is also what ending the program would save that year, before any lost state aid or transition costs. 1 2
| If the program ended and… | Modeled positions | Extra cost of continuing, 2027–28 | What the figure is |
|---|---|---|---|
| Every immersion student attends their home school; classrooms close on both the Chinese and English sides (the district’s assumption, p. 88) | about 10.4 | $1,121,600 | The district’s 2022 method applied to next year’s classes: our preliminary extrapolation, not a verified figure |
| No immersion student stays; Chinese-side positions only | about 8.5 | $946,900 | Our model, extreme case |
| About half of immersion students stay (what we think is realistic; our base estimate) | about 6.5 | $763,500 | Our model; a modeling assumption, not a prediction |
| Every immersion student stays; classes combined under the district’s class-size guidelines (p. 89) | about 4.5 | $580,000 | Our model |
| Every immersion student stays; staffing unchanged (the superintendent, as reported by KCTV5) | 0 | $169,400 | Support costs only; no teaching positions come out |
What we think is realistic. The district's own document says transfer students may stay in their feeder pattern, their siblings may enroll, and "the full financial impact may not be realized immediately" (p. 89). In October 2022 the district counted 94 of 283 Wolf Springs immersion students already living in Wolf Springs' own attendance area; those children stay either way (p. 29). Our base estimate assumes about half of immersion students stay. On that assumption, ending the program saves about $763,500 next year, not the roughly $1.12 million our extrapolation of the district's 2022 worksheet gives for the same year when every immersion student goes home: about $358,000 less. The true figure could be higher or lower. The placement-form totals would settle a key input; staffing schedules and receiving-school capacity are also needed. We are asking for the totals. 1 2
Wolf Springs class sizes in 2027–28 if every immersion student stays
Wolf Springs Elementary, 2027–28: average class size (students per classroom) if every immersion student stays. A projection, not a district figure. Board class-size guidelines: kindergarten 23, 1st 24, 2nd 25, 3rd 27, 4th and 5th 28. 3 Regular classes are this year’s posted class list moved up one grade, with later kindergartens at 41 4; immersion counts are the district’s fall 2026 counts moved up one grade. 1 Existing immersion classes move up a grade with modeled attrition (about 5% a year); a new kindergarten of 46 is assumed. Two or three students can change a grade’s room count.
| Grade | Regular class, program continues | Immersion class | Average class without immersion | Rooms, with → without the program |
|---|---|---|---|---|
| Kindergarten | 20.5 | 23.0 | 21.8 | 4 → 4 |
| 1st | 20.5 | 22.0 | 21.3 | 4 → 4 |
| 2nd | 23.0 | 16.0 | 19.5 | 4 → 4 |
| 3rd | 14.5 | 17.0 | 21.0 | 4 → 3 |
| 4th | 20.3 | 20.5 | 25.5 | 5 → 4 |
| 5th | 19.5 | 20.5 | 26.7 | 4 → 3 |
| Whole school (K–5) | 19.8 (average of all classes) | counted in the average | 22.5 (average) | 25 → 22 |
The savings from ending the program come from larger classes in grades 3 to 5: classes there would rise to about 21, 25.5 and 27, within the Board's guidelines. 3 1


Line by line
The district's figure is the program's extra cost this year. Ours is the extra cost next year in our base estimate (about half stay), a preliminary parent-model estimate under review. The last column explains each difference.
The district’s annual cost of the K–8 Chinese programs beyond a traditional classroom (p. 88), line by line, beside our estimate of the added cost of continuing the program in the next school year, from the line-by-line table below. In today’s dollars; our figures are rounded to the nearest $100, so lines may not add exactly to the total. 1
| Cost | District, 2026–27 (p. 88) | Our estimate, 2027–28 (continuing the full program) | Why they differ |
|---|---|---|---|
| Additional K-8 staffing | $1,080,000 | $594,100 | District: its estimate of this year’s extra staffing cost, which it says would not be incurred if every immersion student attended their home school (p. 88). Its 2022 analysis counted net classrooms closed on both the Chinese and English sides, after regular classes added back at Wolf Springs and Valley Park for children who live there; changes at other schools offset (pp. 24–29). $1,080,000 is about 11.8 teaching positions at $91,477 (our division). Ours: assumes 50% of immersion students stay at their current school (a modeling assumption, not a prediction) and counts only Chinese-side positions, about 6.5, using next year’s classes, when Valley Park has one remaining immersion cohort. A preliminary extrapolation of the district’s 2022 method to next year’s classes gives about 10.4 position equivalents (our calculation, not a verified figure). Both of ours are preliminary estimates under review. |
| Instructional resources | $85,000 | $78,700 | The district’s rate, $85,000 ÷ 460 students = $185 a student, applied to next year’s 426 students. The breakdown is not published; Mandarin vendor payments found in the June 2026 claims report were $49,875. It is not clear how much of this spending remains after this year’s cuts. |
| Instructional support staff (portion of instructional coach and district world language coordinator) | $75,000 | $75,000 | Carried in full. The district describes it as a portion of an instructional coach and the district world language coordinator; the coordinator’s role covers “all K–12 world languages” (p. 7), and both positions may continue regardless of the program. The program’s own instructional design coach ($90,000) was already cut this year (p. 5); the district has not said whether the coach in this line is the same position. |
| Additional substitute teacher costs for conferences | $3,600 | $3,200 | The district’s figure spread over the grade pairs: $450 a pair, 7 pairs next year. |
| Immigration and visa sponsorship fees | $14,000 | $12,500 | Parents report that no current Chinese teachers need visas at this time. We keep the district’s estimate (it says actual costs vary greatly), scaled to the program’s size next year, as a conservative figure. |
| Total | $1,257,600 | $763,500 | District: ≈ $2,730 per student (460 students). Parents: ≈ $1,792 per student (426 students). |
Our base estimate per student
Our base estimate (a preliminary parent-model estimate under review; it assumes 50% of immersion students stay at their current school, a modeling assumption, not a prediction), in 2027–28 and in today’s dollars: continuing the full program is about $1,792 per student ($763,500 for 426 students); sunsetting is about $1,861 per student ($707,300 for 380 students). The difference is about $56,200. Across our low-to-high scenarios, continuing runs from about $140 to $3,300 per student. The district’s figure is a different measure: its $1,257,600 is the program’s extra cost this year, about $2,730 per student for the 460 students enrolled this fall.
What we changed on October 20, and why
On October 20 we updated our cost model in two ways: a cohort-projection correction and a method change.
- Correction. Our model compared each year's immersion class with this year's regular class at the same grade number, instead of moving regular classes up a grade each year. It now moves them up. Later regular kindergartens are assumed to be 41 students, this year's count. 4
- Method change. At Wolf Springs we now count whole classrooms, which is how the district staffs. Every regular grade at Wolf Springs runs exactly the minimum number of rooms the Board's class-size guidelines allow today. Whole-classroom counting sets the staffing credit when every immersion student stays; when only some students stay, the cost is still adjusted in proportion. Our previous, more cautious rule (the higher of two estimates in each grade) is still shown: $804,005 to continue the program and $747,842 to sunset it in 2027–28.
Result. Our base estimate for 2027–28 moved from $816,811 to $763,450 to continue the program, and from $760,649 to $707,288 for a sunset. Most of the change ($40,555 of the $53,361 a year) comes from the method change; $12,806 comes from the correction. These are parent model estimates, not verified district costs.
Supporting evidence. The district's 2022 worksheet projected what would happen if the 245 immersion students who attended on transfer returned to their home schools; it is a projection, not what happened. The 19 other schools would add five grade-level classrooms and remove five, for zero net change. At the building-total level, three schools increased and three decreased. The five removals did not depend on returning students. Excluding them, the worksheet's 14 fewer classrooms is about 9: an adjusted calculation from the district's 2022 projection, not proof of nine avoidable positions today. 1
How many teaching positions
Almost all of the program's extra cost is teachers, so the real question is how many paid teaching positions ending it removes. The district's figure is not the salaries of Chinese teachers: it is the net teaching positions the district expects to save when separate immersion and regular classrooms are combined and students move between schools. Each figure below measures something different, and none is a district headcount or a verified reduction. Each teaching position costs $91,477 in our model: the district's 2026–27 average of $85,732 plus 7.65% payroll tax on the wage part ($75,093), not on insurance benefits.
Our reading
What these savings actually mean
The district's projected staffing savings require eliminating teaching positions that would otherwise be funded, potentially through layoffs or by not replacing departing teachers, while consolidating classrooms could increase class sizes for both former immersion and regular students. If those positions would already have been eliminated because of declining enrollment or other budget cuts, the district cannot reasonably attribute those savings to ending Chinese immersion. One distinction matters: teachers can be reassigned without losing their jobs, and the district can still save money if those transfers eliminate the need to hire replacement teachers elsewhere. Real savings require a real reduction in positions that would otherwise be funded, and that reduction can have consequences for students throughout the district. 1 2
| If the program ends and… | Modeled teaching positions | What the figure is |
|---|---|---|
| The district's staffing line, as published | about 11.8 | The district's estimate of this year's extra K-8 staffing cost, $1,080,000 (p. 88); the position count is our division at $91,477 |
| Students return to their neighborhood schools | 9 | The superintendent's statement, as reported by KCTV5; scope not specified |
| Every immersion student attends their home school | about 10.4 | Our preliminary extrapolation of the district's 2022 net-classroom method to next year's classes (2027-28); not a verified application to current home-school assignments |
| 50% of immersion students stay at their current school (our base estimate) | about 6.5 | Our model, 2027-28 ($594,100 of teacher cost ÷ $91,477), from a simplified Chinese-side staffing proxy, not a districtwide net-position calculation |
| Every immersion student stays and classes are combined | about 4.5 | Our model, 2027-28, same proxy, with whole classrooms counted at Wolf Springs. Wolf Springs Elementary alone, whole classrooms, 2027-28 projection: 3 (25 classrooms to 22; class sizes in 2027-28) |
These are modeled teaching-position equivalents, not verified reductions in paid positions. The district's method counts net classrooms on both the Chinese and English sides. In its 2022 analysis, Wolf Springs and Valley Park were projected to close 14 net elementary sections; changes at the other elementary schools offset one another (five grade-level classrooms added and five removed, for zero net change; at the building-total level, three schools increased and three decreased), leaving the districtwide reduction at 14. 1 The program has fewer classrooms now, and the district has not published a current school-by-school calculation for 2027-28. 1 Sunsetting keeps about 6.0 of the base-estimate position equivalents in 2027-28, fewer because there is no new kindergarten class; that is a modeled figure, not 6.0 actual jobs. 2
- The district says the $1,080,000 would not be incurred "if all students in the program attended their home school." 1 Transfer students may stay in their feeder pattern, and their siblings may enroll too. 1
- The more immersion students stay, the fewer positions come out, and the district says the full savings "may not be realized immediately." It also says it can still combine classes when students stay, but does not say how much smaller the saving would be. 1
- Savings come from combining classes, which can affect Chinese-side, English-side and regular classroom teachers; English-side immersion sections may also be eliminated when students leave. Consolidation can increase class sizes for both former immersion and regular students. The district's October update says its focus includes "maintaining class sizes." 1
- A position saved need not mean a layoff. The 2022 evaluation said it is possible for no current teacher to lose employment in a transition, and immersion elementary teachers hold Kansas elementary teaching licenses and would be placed under the negotiated contract by licensure. 1
- Middle school is different: students who stop taking Chinese Language Arts still need another scheduled class, so its 1.5 position equivalents may not all go away.
- Moving between schools within Blue Valley generally does not change districtwide enrollment. Students leaving the district may reduce enrollment-based funding, depending on the funding formula and enrollment counts. Our model does not yet quantify that effect, and the district's document does not say whether it is counted. 5 1
The placement-form totals would settle a key input; staffing schedules and receiving-school capacity are also needed. We are asking for the totals.
How the district's estimate has changed since 2022
The district's current estimate is on page 88: "nearly $1.3 million in excess expenditures yearly." Of its $1,257,600, $1,080,000 is "additional K-8 staffing," which the district says "would not be incurred" only "if all students in the program attended their home school." 1
In 2022 the district projected this same school year differently. For the plan the Board adopted in 2023, keeping Wolf Springs and phasing out Valley Park, it projected $867,213 of extra cost for 2026–27, counting no classroom teachers. Those projections assumed full classes, "based on maximum enrollment, thus are top-end costs." Most of what they counted, the classroom aides, a coach and teacher stipends, was cut this year: $800,500 in all. 1
| 2022 review | This year | |
|---|---|---|
| Elementary immersion students | about 455 | 278 |
| Chinese classroom aides | 20 or more | none (cut this year) |
| District's extra cost for 2026–27 | $867,213 projected, no classroom teachers | $1,257,600, of which $1,080,000 is classroom staffing |
| Positions saved if the program ends | 14 fewer classrooms in the district's worksheet, all elementary schools | about 11.8, K–8 (our division of $1,080,000) |
Sources: 1
Apart from classroom staffing, the program's extra cost is now about $177,600 a year. The classroom cost comes mainly from older immersion classes running below full: Wolf Springs immersion classes averaged about 24 students in 2022 and about 20 this year. Families have offered to help with the added cost, within the Board's rules. 1 How it could be paid for
Try your own numbers
Pick sunsetting or continuing the full program, with our estimate or an unvalidated illustration that carries the district’s year-one figures forward. Then change the sliders to try your own numbers.
The calculator needs JavaScript and the live website.
Our estimate: 426 (fall 2026 enrollment of 460, minus 59 eighth graders who finish, normal attrition, plus a new kindergarten class of 46). Range: 50% to 150% of our estimate. Later years change by the same percentage. Materials scale with students; cost per student uses the adjusted count.
Our estimate: 5.5. The change you make here is applied to every year, never below 0. Step 0.1.
Our estimate: 0 (parents report none). Each aide adds $26,091 a year.
Our estimate is $91,477. It applies to the elementary and middle school teacher lines.
Other lines fixed at our published estimate.
Matches our published estimate
Added cost of continuing the full program compared with ending the program after 2026–27, by school year, in today's (2026–27) dollars. 2027–28 is next year.
District’s published annual excess cost: $1,257,600 (2026–27). 1
Questions about the district's figures, with page citations
Questions about the district’s figures
These are questions the district can answer with its worksheets; none says the figures are wrong.
- The estimated $1.23 million in savings (p. 93, not labeled first-year) is 98% of the district’s $1,257,600 annual cost. The $1.08 million staffing line is the cost that “would not be incurred” if all program students attended their home schools (p. 88). Page 89 says students may stay and “the full financial impact may not be realized immediately,” and that combining classrooms can still save positions. KCTV5 reported the superintendent said that if parents choose to stay at their current schools, staffing would remain the same. The document does not show which scenario produces the $1.23 million. The option it did not select, a Chinese “special” class families could choose with middle-school Chinese Language Arts phased out, was estimated at $1 million in the first year (p. 93). 1 2
- Was the $1,080,000 computed the way the October 2022 “Net Effect of Immersion Participant Migration” worksheet did it (sections closed at both sites, net of regular sections added back at those schools; changes at the other elementary schools offset, with five grade-level classrooms added and five removed, for zero net change)? If so, may the 2026 worksheet be published; if not, what method was used? 1
- Please provide the staffing calculation behind the $1,080,000 for 2027-28: current positions, positions after the change, positions needed at receiving schools, and the net districtwide change. Please show it two ways: every immersion student stays at their current school, and every transfer student returns to their neighborhood school. 1
- The district’s October update describes “another year of declining enrollment” (p. 3). Were any of the positions in the $1,080,000 already expected to be reduced because of enrollment or the other reductions under way? If so, are they also counted in this saving? 1
- Page 89 says the district can still combine classes when students stay (its example: four classrooms to three), while KCTV5 reported the superintendent said staffing would remain the same if families stay. Please reconcile the two: which is the planning assumption, and how much smaller is the saving when students stay? 1 2
- How would class sizes change for immersion and regular students at Wolf Springs, Valley Park and the receiving schools in 2027-28? 1
- Valley Park will have one immersion grade in 2027-28 whether the program continues or is sunsetting (grade 5: this year’s 20 fourth graders, p. 91). Does the $1.23 million reflect the 2027-28 structure or the 2026-27 structure? 1
- If every current immersion student stays, KCTV5 reported the superintendent said staffing would remain the same, while the document describes consolidating classrooms at class-size guidelines (four to three). Which is the planning assumption for Wolf Springs in 2027-28, and how many homerooms per grade does it expect? 2 1
- Will the district publish the aggregate School Placement Preference Form results for immersion families (number staying, by grade and school) before the 2027-28 staffing plan is set, so the savings figure can be updated on actual choices? 1
- The October 14 recommendation was reviewed against the 2022 figure, “just under $1 million” (p. 4). The 2022 projections for the plan the Board adopted counted no classroom teachers and put this year’s extra cost at $867,213 (p. 21); $800,500 of what they counted was cut for 2026-27 (p. 5). Page 88 now puts the extra cost at $1,257,600, mostly classroom staffing. Which figure was used for the decision, and what is the program’s extra cost today apart from classroom staffing? 1
- By our subtraction of two printed district figures ($1.23 million less $360,000; the $360,000 is labeled first-year; the $1.23 million is not), sunsetting costs about $870,000 more in year one than ending at the high-school level only, if both are first-year (p. 93). The option of a Chinese “special” class families could choose (the 2022 evaluation described such a special as 2–3 hours a week, p. 17; the 2026 option gives no hours, p. 93) was estimated at $1 million (p. 93). The document lists each option’s first-year savings; the reasoning for the choice among them and later-year figures are not included, and we ask that they be published. 1
- The $75,000 for instructional support staff is a share of an instructional coach and the district world language coordinator (p. 88): two salaries that may continue; the coordinator’s role covers “all K–12 world languages” (p. 7), and high-school Chinese continues (p. 92). Which part of it ends is not shown. 1
- The $85,000 for instructional resources is about 70% more than the $49,875 paid to two Mandarin curriculum vendors in the June 30, 2026 claims report; the difference is not itemized in the document. 1 6
- $1,080,000 ÷ $91,477 per position (the district average of $85,732 plus 7.65% payroll tax on the wage part) is about 11.8 positions; that is our division, not a district count. KCTV5 reported the superintendent said nine positions would be saved if students return to their neighborhood schools. The two may count different things, for example elementary only versus K-8; the document does not say how many positions the line contains. The district’s own example of 36 immersion and 29 non-immersion students served in three classrooms instead of four (p. 89) shows a smaller saving when students stay. 1 7 2
- The $360,000 first-year figure for a sunset has no published breakdown. 1
- Whether the $1,080,000 staffing line includes retirement (KPERS) contributions, which the state funds and passes through districts (K.S.A. 74-4939a; $26,602,276.79 for Blue Valley in FY2026), is not stated. 1 8 9
- Kansas foundation aid is based on enrollment counted each September 20, the greater of the current or prior year (K.S.A. 72-5132). Families who leave Blue Valley, as distinct from changing schools within it, would reduce future state aid; the document does not say whether that is netted against the savings. 5
- The document gives first-year savings only (p. 93). Five-year savings for each option it considered, not just year one, are not shown. 1
- The parent-funded statement addresses tuition and fees for consumable materials (p. 93); it does not address voluntary gifts accepted by the Board under K.S.A. 72-1142 and Policy KH. 1 10 11
- Before placing classroom programs such as Chinese immersion on the reduction list, did the Board consider holding down administrator pay growth (cost per administrator position rose 21% from 2022–23 to 2025–26)? A 5% reduction in the 2026–27 administrator total is about $935,000. Please publish any such comparison. 7 1
- In the district’s own 2022 model, 22 immersion sections closed, 8 regular sections were added back at the same two schools for the “Immersion Returns” (94 at Wolf Springs, 116 at Valley Park), and “District net sections” was −14, not −22. The model kept 94 of 283 Wolf Springs immersion students at Wolf Springs and 116 of 172 Valley Park immersion students at Valley Park. 1
- Students who leave immersion but stay in Blue Valley still need a teacher, at Wolf Springs or their home school; only students who leave the district reduce the district’s teaching needs. Combining classrooms can still reduce positions even when students stay. 1
- The 2022 evaluation says that beginning in 2020–21 the program at Valley Park “was limited to students residing in the VPE residency boundaries and legacy siblings.” Valley Park’s current immersion students’ home school is therefore Valley Park, and they would stay there either way. 1
- The same evaluation says “There is little attrition in the program.” 1
- On a transition, the 2022 evaluation says “It is possible to not experience any loss of employment of current teachers in the transition,” and that “a longer, tapered transition does not realize the budget benefits of a quicker change.” 1
- The document does not report how many Wolf Springs immersion students live in the school’s area, transfer from elsewhere in Blue Valley, or live outside the district.
Documented
Retirement contributions for school employees (KPERS) are paid by the state through the Department of Education and distributed to districts; KSDE reports $26,602,276.79 to Blue Valley for FY2026. The district's document does not say whether the $1,080,000 staffing line includes such contributions, and Budget at a Glance does not say whether the $85,732 teacher average does. 8 9 1 7
Documented
Kansas foundation aid is enrollment-based: base aid times adjusted enrollment, counted on September 20 as the greater of the current or the preceding year. A family that moves its child to another school inside Blue Valley does not change the district's enrollment; a family that leaves the district would, over time, reduce state aid. The district's document does not say whether that is netted against its savings estimates. 5 1
What our estimate does not cover
- Families leaving the district: lost state aid is not modeled.
- High-school Chinese is not costed.
- Real staffing changes in whole classrooms; our model uses fractions, so true savings move in steps.
- The district's worksheets are not published, so we cannot check its figures.
- New kindergarten demand is unknown; we assume 46 a year.
Full list: Where our estimate is weak.
Administrator pay and the budget
Administrator pay (the Board sets it; KSDE's "administrators" category includes principals, assistant principals, directors and central-office leaders)
- Total pay and board-paid benefits, as reported to KSDE: $15,339,409 (2022–23) to $19,020,986 (2025–26), up 24.0%. Positions rose only 2.2% (102.5 to 104.8 FTE), so cost per position rose 21.3% (about $149,700 to $181,500). Inflation over the same years: about 9–10% (our calculation, BLS CPI-U: 2022 to 2025 annual average +10.0%; June 2022 to June 2025 +8.9%). 12 7
- Raises: 6% in 2023–24, a raise in 2024–25 (percentage not published), 4% in 2025–26, none for 2026–27. 13 14 15 Compared with typical U.S. raises: year-by-year table.
- Over the same period the district was weighing cuts: it studied Chinese immersion in fall 2022 (the evaluation put the program's total cost beyond regular classes at "just under $1 million" a year, p. 4, and an October 24, 2022 update estimated the savings from ending both programs at "around $1.5 million and could be as much as $2 million," p. 16) 1, and in each of the last two years it has moved more than $16 million to cover special education ("more than $16 million" from the general fund in 2025, by its legislative page; "$18.9 million from other district resources" "last year," by its October 16 update). 16 15 1
- For scale, not as a proposal: had cost per administrator position kept pace with inflation since 2022–23, the district would have spent about $3.4 million less over three years (about $0.34 million in 2023–24, $1.26 million in 2024–25 and $1.78 million in 2025–26). Each of the last two years is more than the district's $1,257,600 yearly figure for Chinese immersion (by our reading, that figure assumes every transfer student leaves). A 5% trim to the 2026–27 administrator total would be about $935,000, more than our $763,500 estimate for 2027–28. These are illustrations, not proposals or money already available: contracts can limit mid-term pay changes, and the work still has to be covered. In a tight budget, we ask the Board to weigh classroom programs alongside administrative costs when it compares reductions, and to publish that comparison. 7 1 17
Chinese immersion teacher pay
- The district's H-1B filings with the U.S. Department of Labor (2017 to 2025, years mixed) list Chinese immersion teacher base salaries of $50,000–$57,182 (before benefits), as compiled by aggregators of Labor Department data (indicative only). 18
- A district-average teacher costs $85,732 in pay and board-paid benefits and $91,477 with payroll tax on wages. If the state-paid KPERS contribution (11.32%, FY2027) were also counted, it would be about $100,000 (our arithmetic). Our model uses $91,477 and does not count KPERS. 7 19
More detail
Each item opens in place.
Best case to worst case over eight years
- Two kinds of range. The narrower range near the top of this page is our central estimate for one year. The low–high in the table runs from best case (LOW: every immersion student stays, no 2023-era support costs remain) to worst case (HIGH: most immersion students leave, all support costs continue), with BASE between. These are assumption scenarios, not confidence bounds. Continuing in 2027–28 alone: best case to worst case is $0.06M–$1.39M.
- Who is counted. Sunset covers students already enrolled K–8 in 2026–27. Continuation also adds a new kindergarten class of 46 each year (enrollment demand is unknown), so the rows share a time horizon, not a population. Continuing has no end date and creates obligations beyond the eight years.
- What is not counted. Figures use current district pay and costs and do not assume further district budget cuts. The estimate covers grades K–8 through 2034–35. High-school continuation is part of the ask but not costed.
- Simplified staffing. Staffing is modeled linearly on fractional positions, while real staffing changes in whole positions. District data (FIN03 and FIN05) would replace the assumptions.
- Deficit comparison. The comparator is the district’s projected $4 million deficit. 20
Parents’ estimates (model v1.5.0, 2026), not district figures: cost added on top of cancelling after 2026–27, in today’s (2026–27) dollars.
More on the scenarios: all-stay, staffing unchanged, zero lines
Our readingConditional
Our arithmetic, not a district count: the district's $1,080,000 staffing line divided by $91,477 (the district's 2026–27 average of $85,732 plus payroll tax on the wage part) is about 11.8 positions. Separately, a news report gave nine positions, scope not specified. Nine positions at the district average of $85,732 (salary, supplemental pay and board-paid insurance) is about $771,588 a year; about $823,293 with estimated payroll tax on the wage part. The district's line and the reported nine may count different things, and no published document reconciles them. That is an illustrative gross cost of nine average positions before reassignment or attrition, not an upper bound and not a savings estimate: actual positions sit above or below the average; a teacher reassigned to a vacancy the district would otherwise fill from outside does save the avoided hire, but that saving counts once, only if verified, and our model sets it to zero (term V) until the district documents it; and KCTV5 reported positions, not dollars. The state's 2025–26 report puts the all-in average at $86,960. 7 21 2
The biggest swing is how many immersion students stay. Sunsetting (every current K–8 student finishes, row 2), everything else at base:
- Every immersion student stays: about $2.08 million.
- 50% of immersion students stay (our base estimate): about $2.44 million.
- Most leave: about $2.81 million. Children who stay still need classroom teachers. This counts only Chinese-side positions; the district's method also counts English-side sections.
These are discrete scenarios, not a per-family rate. Staffing changes in whole sections, and the district has not published how placement-form responses translate into sections or positions. If staying is your family's real choice, say so on the form: Take Action, step 2. 2 22 1
Even the all-stay figure is our estimate, not the reported district condition. It still counts some teacher cost for small immersion classes at the district class size guidelines.
- If staffing truly stayed the same, as reported, sunsetting would add no teacher cost. The all-stay figure would be about $672,500, all support costs (instructional support staff, visas, materials and similar).
- The stipend, aide and coach lines are $0 at base because the district lists them among its 2026–27 reductions. The consultant and dean lines are $0 because its list of current costs names neither. 2 1
The question that matters
Cancelling could produce real savings and still be the wrong choice. The question is how much more sunsetting costs than cancelling, and whether that is worth avoiding an abrupt disruption. Real savings = what stops being spent, minus what keeps being spent or newly gets spent.
- Sunsetting is different from continuing the full program. Enrolling new kindergartners and sunsetting (every enrolled student finishes) are separate decisions. The district should price them separately; each option is its own row in the table above.
- Show the extra savings from ending abruptly. Compare cancellation with sunsetting (no new entry), counting ordinary instruction, receiving-school staffing and transition costs in both. That difference is the financial benefit being weighed against disrupting current students.
- District figures, subtracted ($1.23 million less $360,000, our subtraction; the $360,000 is labeled first-year; the $1.23 million is not): about $870,000 if both are first-year, shrinking each year as classes finish. 1
- Our estimate (not a district figure): sunsetting adds about $2.44 million over eight years compared with cancelling, $707,300 of it in 2027–28 (our base estimate); about $672,500 to $2.81 million across the staffing scenarios.
- Compare workable alternatives. Could consolidation, adjusted support staffing or another instructional arrangement keep a meaningful pathway at lower cost? Voluntary parent funding, with families helping pay part of the added cost of continuing the full program or of sunsetting, is a possible way to offset cost, if the Board finds an avenue within the district's rules. These are options to evaluate, not savings we can assume. See Options.
- For comparison only. On September 17, 2026, the Chapel Hill-Carrboro (North Carolina) board voted 4–2 to end the less intensive Mandarin world-language program at Glenwood Elementary (45 minutes of Mandarin a week, not immersion), with an exception allowing current fourth graders to finish the final year; a board member estimated about 33 fourth graders and 10 siblings. Its separate dual-language immersion track was moved to another school by an August vote. 23
The district's four options, and its 2022 staffing method as we reconstructed it (not district figures)
The district’s own estimates for the first year, 2027–28, each with “additional savings in the subsequent years.” The difference row is our subtraction of the district’s two figures. The worksheets behind the estimates are not published. 1
| Option the district considered | District’s estimated savings, as printed (p. 93; all but the first row say “in the first year”) |
|---|---|
| Chinese at the high-school level only (the option selected) | $1.23 million |
| Phase out middle-school Chinese Language Arts and discontinue elementary programming | $1.1 million |
| A Chinese “special” class families could choose at elementary (the 2022 evaluation described such a special as 2–3 hours a week, p. 17; the 2026 option gives no hours), and phase out middle-school Chinese Language Arts | $1 million |
| Sunset the elementary immersion and middle-school Chinese Language Arts programs | $360,000 |
| Difference: the option selected minus the sunset | $870,000 |
| Difference: the option selected minus the Chinese special option | $230,000 (about $500 for each of the 460 students enrolled) |
The district's published costs beside our estimate. The table shows the district's line-by-line cost for 2026–27 and our estimate for 2027–28. The columns are different school years, so the sentence under the table puts our model on the district's method for 2027–28.
The district’s published annual cost (2026–27) beside our estimate of the added cost of continuing the full program next year (2027–28), in today’s dollars. The two columns are different school years, so the table is not a like-for-like comparison; the sentence below it puts our model on the district’s method for 2027–28. 1 6
| Cost | District as published, 2026–27 (p. 88) | Our estimate, 2027–28 (continuing the full program; preliminary, under review) |
|---|---|---|
| Extra staffing | $1,080,000 | $594,100 |
| Instructional resources | $85,000 | $78,700 |
| Support staff (coach and coordinator share) | $75,000 | $75,000 |
| Visas | $14,000 | $12,500 |
| Substitutes | $3,600 | $3,200 |
| Other lines (dean, coach, stipends, aides, consultant) | not listed | $0 |
| Total | $1,257,600 | $763,500 |
| Students | 460 | 426 |
| Per student | ≈ $2,730 | ≈ $1,792 |
Our extrapolation of the district’s 2022 worksheet to 2027–28 (every immersion student returns to their home school; changes at the other elementary schools offset) gives $1,121,633 to keep the program. This is not a verified district estimate for next year. 1
Run through our model on the district’s own staffing method, the 2026–27 program (8 grade pairs, 9 Chinese Language Arts sections, 460 students) comes to $1,246,300, within 1% of the district’s $1,257,600. The difference between the two columns above is therefore mostly the staffing method and a program that is a little smaller next year, not arithmetic. The district’s staffing line is the cost that “would not be incurred” if all program students attended their home schools (p. 88); page 89 says transfer students may stay through graduation and that the full financial impact may not be realized immediately. 1
Documented
The district's October 2026 data document says the recommendation communicated on October 14, 2026 followed a review of the 2022 program evaluation "in its entirety, including the total cost in excess of regular programming. That figure at that time was just under $1 million. These figures were used to estimate the ongoing costs, not adjusted for inflation or any consideration for staff salary increases." 1
Documented
The same document lists reductions that "went into effect for the 2026-27 school year": Chinese para support, $654,000; additional 3% salary for teachers, $50,000; training and professional learning, $6,500; and the Chinese Immersion Instructional Design Coach (IDC), $90,000; $800,500 in all; the district calls them "estimates based on historical costs" and says "the salary figure includes base salary, payroll taxes and district-paid benefits." It adds that "there remains a substantial cost for the program in excess of educating students in the traditional classroom." Our cost model counts those four lines at $0 at base. 1
Documented
The district's document gives the K–8 Chinese programs' annual cost beyond a traditional classroom as $1,257,600: additional K–8 staffing, $1,080,000; instructional resources, $85,000; instructional support staff, $75,000 ("Portion of Instructional Coach & District World Language Coordinator salary and benefits"); additional substitute teacher costs for conferences, $3,600; and immigration and visa sponsorship fees, $14,000 ("This is an estimate. Actual costs vary greatly based on individual circumstances."). It says the staffing figure "only includes the excess staffing needed for the Chinese programs at elementary and middle school. In other words, if all students in the program attended their home school, this cost would not be incurred by the district," that "the staffing estimate includes an average salary, payroll taxes and district-paid benefits," and that the figures are "annual estimates based on historical costs" that "do not assume increases due to inflation." 1
Documented
On transfers, the district's document says students who transfer for Chinese Immersion "may remain at their current school," and says: "Consistent with the district's current transfer process, these students may also remain in their chosen feeder pattern through graduation unless they choose otherwise." It says that "as fewer students attend their current school on transfer, the district will see a reduction in additional staffing costs. While the full financial impact may not be realized immediately, these ongoing savings are significant when considering the district's long-term financial challenges." It adds: "Allowing students to remain at their current schools does not mean the Chinese Immersion Program will continue." And it notes that "the district can still achieve staffing efficiencies even when students remain at their current schools": "a grade level with 36 immersion students and 29 non-immersion students may currently require four classrooms. When all 65 students are considered together, the district could serve those students in three classrooms, reducing the need for one teaching position." 1
Where our estimate is weak
- English-side sections. Our base method counts the Chinese-side teacher of each grade pair. For students who return home, the district’s method may also eliminate the English-side section. That is why the district-method case (about 10.4 position equivalents next year, a preliminary extrapolation) is higher than our “most leave” scenario.
- The stay share is a modeling weight, not a count. At Wolf Springs we count whole classrooms (the way the district staffs), which sets the credit when every immersion student stays; when only some stay, the cost is still adjusted in proportion, while real staffing changes in whole classrooms. Children who already attend their home school stay there either way, and only transfer students choose; the district’s 2022 model kept 94 of 283 Wolf Springs immersion students at Wolf Springs 1. Real savings move in steps.
- Middle school. Whether the 1.5 FTE of Chinese Language Arts is avoidable is uncertain (range about 0.5–1.5 FTE).
- Enrollment. The 46-student kindergarten is the 2026 figure (35 and 37 in the two years before); future demand is unknown.
- Conservative lines. The $75,000 support-staff allocation and the district’s low $14,000 visa estimate are used as published; teacher cost is a district-wide average, and these teachers may cost more or less.
- Not modeled. State aid lost if families leave the district, one-time transition costs, and high-school sections below the district’s minimum of “typically 18 students.”
How we built the estimate: scenarios, teacher cost, staffing, what would change
What is measured
- Cost: the added general-operating cost of each option compared with cancelling after 2026–27, over 2027–28 through 2034–35, in today's (2026–27) dollars. The baseline is "the same students in regular classes," not zero.
- Who is covered: Sunsetting covers the students enrolled K–8 in 2026–27. Continuation also adds a new kindergarten cohort each year. The options share a time horizon, not a population.
- Scenarios: LOW, BASE and HIGH are internally consistent assumption scenarios, not probabilities or confidence bounds. LOW: every immersion student stays, no 2023-era support costs remain. HIGH: most immersion students leave, all support costs continue. BASE sits between.
- Cost drivers: teacher pairs (at least one per grade per school while a cohort runs), middle-school Chinese Language Arts sections, instructional support staff, visas and materials. The stipend, aide, consultant and coach lines are $0 at base. Cohort sizes are the district's fall 2026 counts, aged at the rates its own enrollment history shows. 1 24
- Inputs we could only read from Board packets:
- Thirteen "ADDL TEACHING CI-YEAR" supplemental contracts at the two immersion elementary schools in 2025–26 (twelve in the October 13, 2025 addendum, one in the September 8 addendum), with no amounts printed (our high case restores them). 25 26
- Vendor payments of $32,620 to Mandarin Matrix and $17,255 to Level Chinese in the June 30, 2026 claims report, with no fund or purpose printed (our low materials case; the base case uses the district's $85,000). 25 6 1
- Reproducible: the model uses no randomness. Rerunning it from the inputs below reproduces every figure on this site. The model file this page was checked against has SHA-256
ee628f8b580d5639a3b2bd5de1465467efaa84801203438a92928426849e6791.
Teacher cost, step by step
- District average. The district's 2026–27 contracted average for full-time teachers is $85,732. The state form that produces it includes supplemental and extra pay and board-paid fringe benefits (group life, health, disability and similar insurance). It excludes Social Security, workers' compensation and unemployment insurance. So nothing is added for fringe or supplemental pay. 7
- Split. The 2026–27 split is not published. The state's 2025–26 report for Blue Valley gives salary $72,488, supplemental $3,681, board-paid fringe $10,790, total $86,960 (the parts sum to $86,959; $1 rounding in the source). Fringe is 12.41% of the total; we assume the same share in 2026–27, an estimate. 21
- Payroll tax. Employer payroll tax (Social Security and Medicare, 7.65%) applies only to wages, so it is charged on the wage part: $85,732 × (1 − 0.1241) = $75,093, not on insurance. An earlier version charged it on the whole amount; an independent audit caught that, and version 1.1.0 corrects it.
- Three cases. LOW $85,732 (no payroll tax). BASE $91,477 (adds payroll tax on wages). HIGH $92,978 (BASE plus a 2% workers' compensation and unemployment load on wages, an estimate).
- Cross-check with the district's staffing line (our arithmetic, not a district figure). $1,080,000 ÷ $91,477 is about 11.8 positions (about 12.6 at the $85,732 average, before payroll tax). The district says its staffing figure includes salary, payroll taxes and district-paid benefits (p. 88). This is an illustration; our model's cost per position is unchanged. 1
- Visa-sponsored wages. Public H-1B filings by the district list Elementary Chinese Immersion Teacher wages of about $50,000 to $57,000 (four filings, mixed years, base wages at filing, before benefits). This is a third-party aggregate of Department of Labor data and is indicative only. 18
Staffing scenarios: no per-family rate
Three discrete assumption scenarios, not confidence bounds and not a per-family rate. The only evidence is an aggregate statement, as reported by KCTV5. 2 The weight is applied linearly to all modeled students; real staffing changes in whole positions.
| Staffing scenario | Assumed blended share staying (all modeled students) | Full-sunset total, 2027–35 (base settings) |
|---|---|---|
| All stay, staffing unchanged (district statement as reported) | 100% | $0.67M |
| All stay (district class size guidelines) | 100% | $2.08M |
| About half stay | 50% | $2.44M |
| Most leave (modeled as none stay, the extreme) | 0% | $2.81M |
| Our model with the district's 2022 staffing method: every student returns home | 0% (all return home; both sides’ sections close, net of receiving schools) | $3.21M |
- The only public evidence is an aggregate conditional statement reported by KCTV5: the superintendent said cutting the program would save nine teacher positions if students returned to their neighborhood schools, and that if parents choose to stay at their current schools, staffing would remain the same (the reporter's paraphrase, not a quotation). 2
- Staffing changes in whole sections and depends on capacity at both sending and receiving schools, so the effect is stepwise and cannot be known without district section counts. Nothing here says what one family's choice is worth.
- The first two rows differ only in how much teacher staffing the staying children need. "Staffing unchanged" follows the reported district condition: no teacher cost is added, only the support lines the district publishes (instructional support staff, visas, materials and substitutes, p. 88), carried at the district’s amounts. 1
- Dean and Chinese-side coaching supplemental are $0 at base and unconfirmed: the supplements are documented, but whether any salary cost of these roles ends with the program is not confirmed.
- "District class size guidelines" is our base-settings estimate. It still counts some teacher cost for small immersion classes.
A simplified model
- The staffing credit is applied linearly to fractional positions, the same way to every modeled student. It does not model actual receiving-school classrooms, vacancies or integer staffing, so real staffing, which changes in whole positions when a class crosses a threshold, could land above or below any scenario.
- The staying weight (
stay_share) is a blended share of all modeled immersion students assumed to stay at their current school. It is not the share of transfer students who stay: the model has no split between students who already attend their home school and transfer families. (The district's 2022 model kept 94 of 283 Wolf Springs immersion students at Wolf Springs, p. 29.) - It does not value an outside hire avoided at a receiving school (term V in the net-savings formula is set to zero).
- We are asking for district staffing data (FIN03, position-level reassignment and replacement; FIN05, section and classroom counts by school) to replace these assumptions.
Year by year, including the first implementation year
The yearly added cost behind the eight-year totals, from the model file. 2027–28 is the first year of implementation. These are assumption scenarios, not confidence bounds.
Continue full program (ongoing, new kindergarten cohort each year). Added cost versus cancelling, in today's (2026–27) dollars. 2027–28 is the first year of implementation.
| School year | LOW | BASE | HIGH |
|---|---|---|---|
| 2027–28 | $61,549 | $763,450 | $1,392,515 |
| 2028–29 | $56,373 | $666,684 | $1,245,451 |
| 2029–30 | $52,909 | $652,999 | $1,220,312 |
| 2030–31 | $50,537 | $624,951 | $1,177,795 |
| 2031–32 | $48,056 | $597,808 | $1,135,093 |
| 2032–33 | $47,839 | $597,983 | $1,134,723 |
| 2033–34 | $48,483 | $613,125 | $1,155,058 |
| 2034–35 | $49,242 | $613,057 | $1,156,352 |
| Eight-year total | $414,988 | $5,130,055 | $9,617,299 |
Sunsetting: every current student finishes (no new kindergarten class). Added cost versus cancelling, in today's (2026–27) dollars. 2027–28 is the first year of implementation.
| School year | LOW | BASE | HIGH |
|---|---|---|---|
| 2027–28 | $54,638 | $707,288 | $1,242,495 |
| 2028–29 | $42,767 | $554,729 | $945,781 |
| 2029–30 | $32,826 | $485,621 | $771,361 |
| 2030–31 | $24,302 | $356,966 | $580,117 |
| 2031–32 | $15,885 | $229,585 | $389,058 |
| 2032–33 | $9,841 | $54,707 | $93,719 |
| 2033–34 | $6,486 | $41,752 | $68,765 |
| 2034–35 | $3,463 | $13,412 | $25,139 |
| Eight-year total | $190,209 | $2,444,060 | $4,116,435 |
How net savings should be measured
The right question
- Start with: What the program costs todayG
- Minus: Costs that continue anyway or move elsewhereC
- Minus: New costs to replace itR
- Minus: One-time transition costsT
- Minus: Lost revenue or knock-on costsL
- Plus: Outside hires avoided by reassigning staff (counted once, only if verified)V
- Equals: Real savings from cancelling
Net savings = G − C − R − T − L + V
In plain terms: start with what the program costs, subtract what the district keeps paying anyway, and subtract new costs the change creates. Every input is still missing from the public record, so the true figure is unknown, not zero.
- A 50/50 immersion class still teaches the ordinary curriculum. Cancellation does not remove students' need for classroom teachers.
- If a Chinese-side teacher moves into a needed regular classroom, the program allocation disappears but the payroll continues. That move can also avoid a separate hire for a real vacancy.
- Neither "every salary is saved" nor "reassignment saves nothing" is reliable without position-level records.
Illustration only: why the assumptions matter
Avoid / caution
Illustration, not a forecast. These are arbitrary illustrations, not district figures. The $500,000 pool is not the historical $510,000 and not a current budget. Every case assumes replacement cost R = $0, avoided hire V = $0 and lost revenue L = $0.
| Share of a $500,000 pool avoided | One-time transition | Year-one net | Later years, net |
|---|---|---|---|
| 25% | $50,000 | $75,000 | $125,000 |
| 50% | $50,000 | $200,000 | $250,000 |
| 75% | $50,000 | $325,000 | $375,000 |
| 100% | $50,000 | $450,000 | $500,000 |
| 25% | $150,000 | −$25,000 | $125,000 |
What keeping the program costs, line by line: inputs, formulas, enrollment
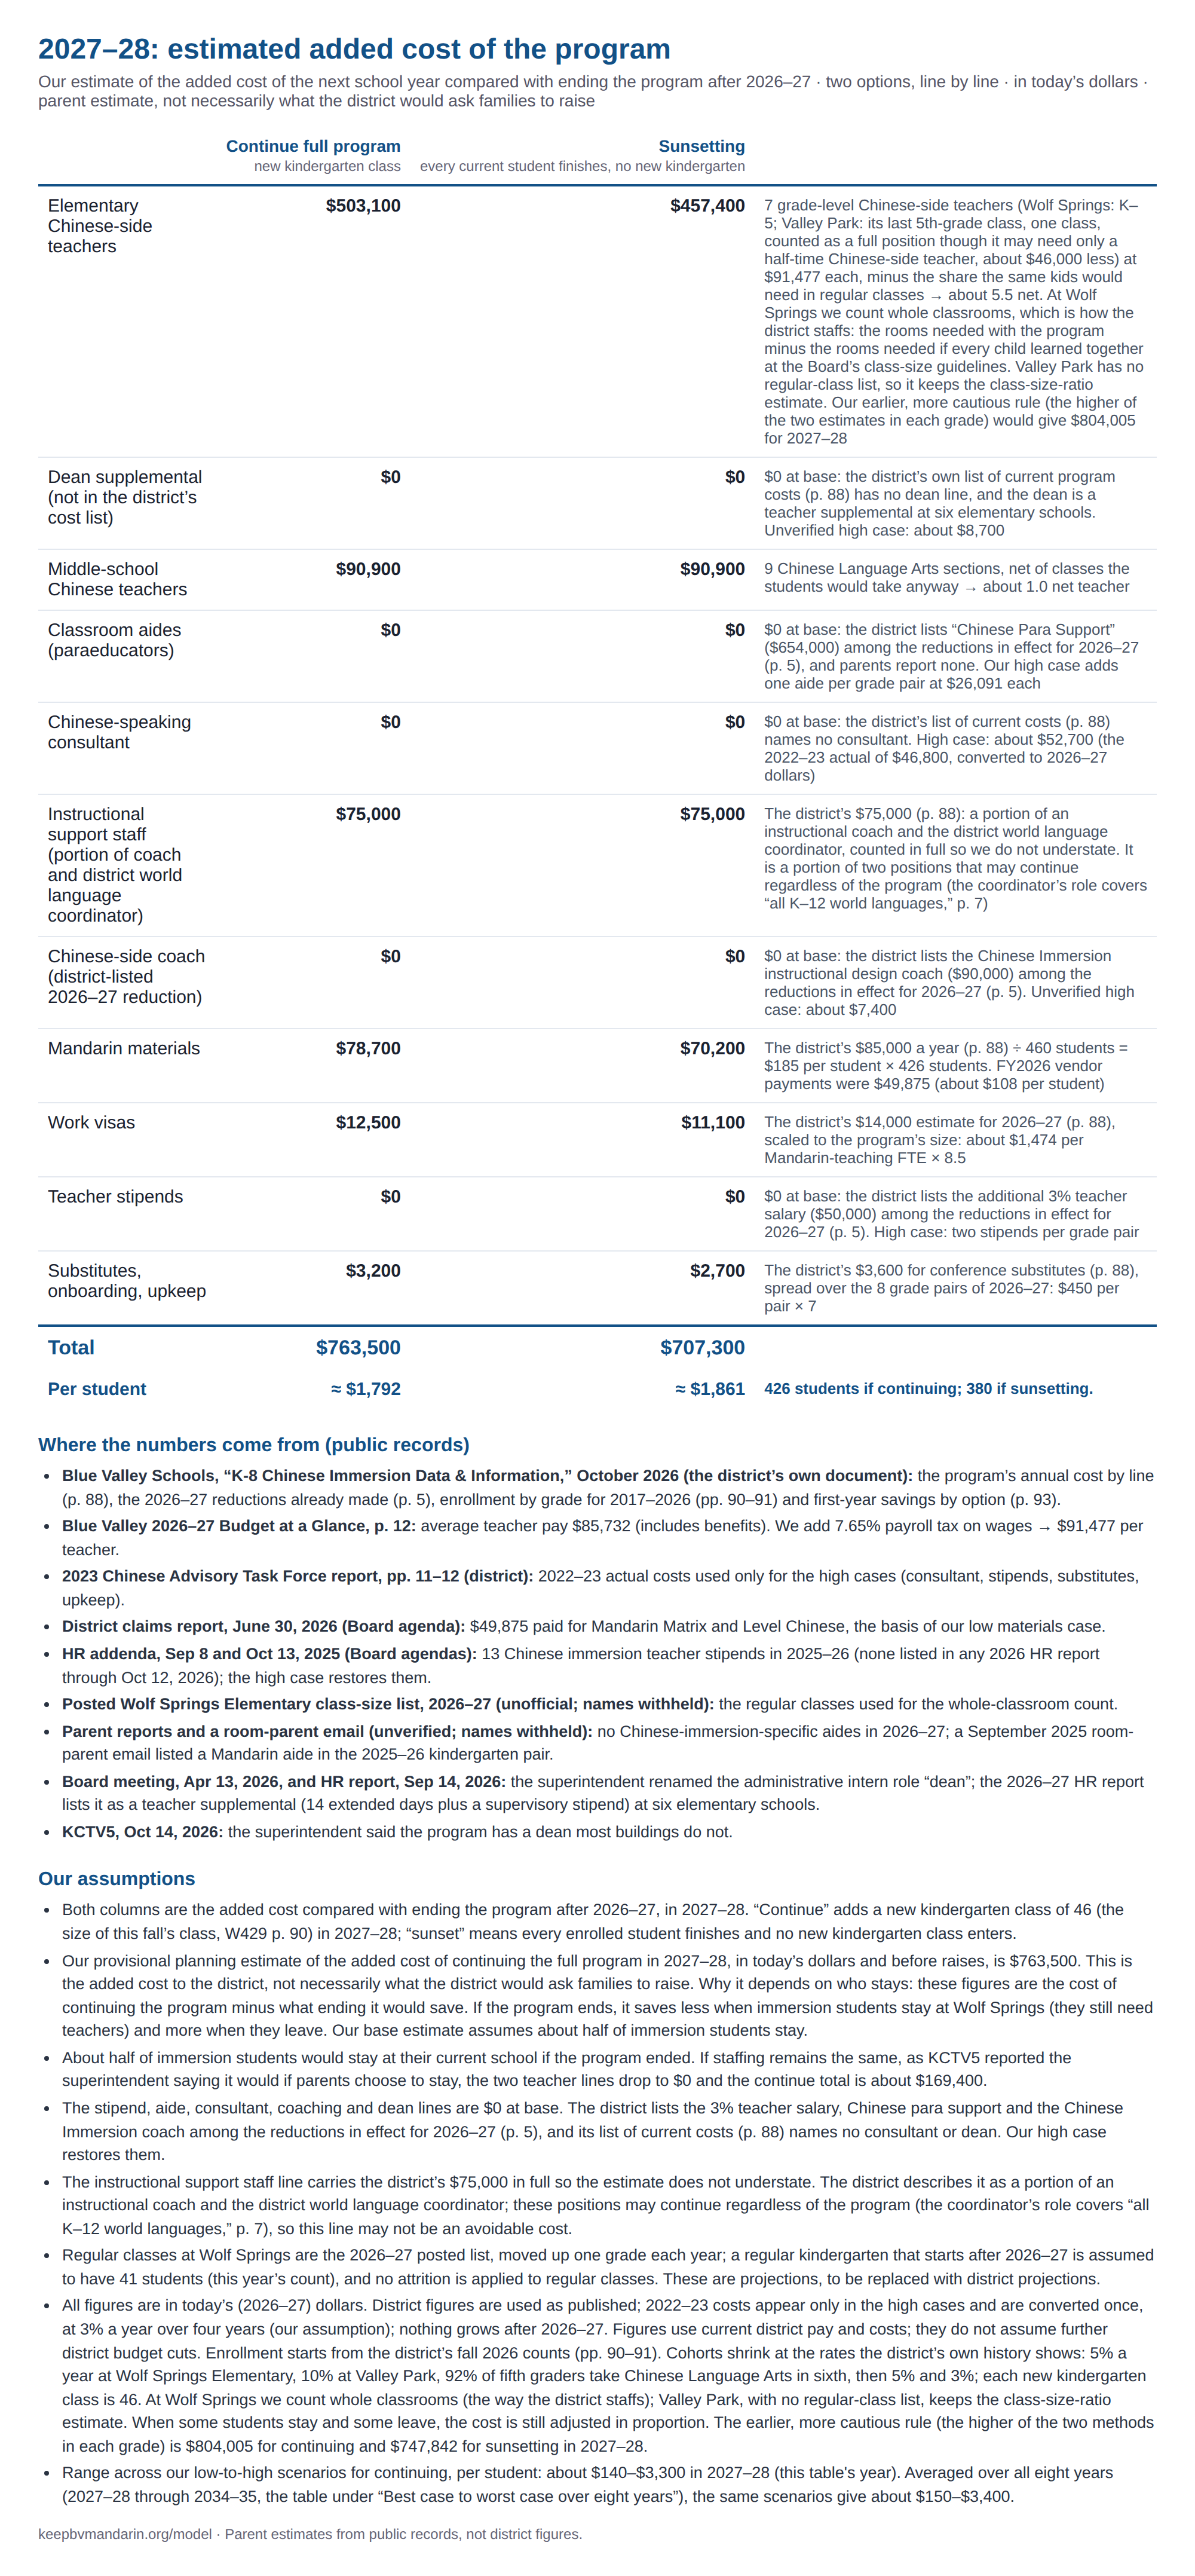
Added cost in 2027–28, the next school year, compared with ending the program after 2026–27. Left column: continue the full program, with a new kindergarten class entering in 2027–28. Right column: sunsetting, where every current student finishes and no new kindergarten class enters. In today's (2026–27) dollars, rounded to the nearest $100 (lines may not add exactly to the total); a parent estimate, not district figures.
| Cost | Continue full program (new kindergarten class) | Sunsetting (every current student finishes, no new kindergarten) | How we estimated it |
|---|---|---|---|
| Elementary Chinese-side teachers | $503,100 | $457,400 | 7 grade-level Chinese-side teachers (Wolf Springs: K–5; Valley Park: its last 5th-grade class, one class, counted as a full position though it may need only a half-time Chinese-side teacher, about $46,000 less) at $91,477 each, minus the share the same kids would need in regular classes → about 5.5 net. At Wolf Springs we count whole classrooms, which is how the district staffs: the rooms needed with the program minus the rooms needed if every child learned together at the Board’s class-size guidelines. Valley Park has no regular-class list, so it keeps the class-size-ratio estimate. Our earlier, more cautious rule (the higher of the two estimates in each grade) would give $804,005 for 2027–28 |
| Dean supplemental (not in the district’s cost list) | $0 in both options (unconfirmed) | $0 at base: the district’s own list of current program costs (p. 88) has no dean line, and the dean is a teacher supplemental at six elementary schools. Unverified high case: about $8,700 | |
| Middle-school Chinese teachers | $90,900 | $90,900 | 9 Chinese Language Arts sections, net of classes the students would take anyway → about 1.0 net teacher |
| Classroom aides (paraeducators) | $0 in both options (district-listed 2026–27 reduction) | $0 at base: the district lists “Chinese Para Support” ($654,000) among the reductions in effect for 2026–27 (p. 5), and parents report none. Our high case adds one aide per grade pair at $26,091 each | |
| Chinese-speaking consultant | $0 in both options (unconfirmed) | $0 at base: the district’s list of current costs (p. 88) names no consultant. High case: about $52,700 (the 2022–23 actual of $46,800, converted to 2026–27 dollars) | |
| Instructional support staff (portion of coach and district world language coordinator) | $75,000 | $75,000 | The district’s $75,000 (p. 88): a portion of an instructional coach and the district world language coordinator, counted in full so we do not understate. It is a portion of two positions that may continue regardless of the program (the coordinator’s role covers “all K–12 world languages,” p. 7) |
| Chinese-side coach (district-listed 2026–27 reduction) | $0 in both options (district-listed 2026–27 reduction) | $0 at base: the district lists the Chinese Immersion instructional design coach ($90,000) among the reductions in effect for 2026–27 (p. 5). Unverified high case: about $7,400 | |
| Mandarin materials | $78,700 | $70,200 | The district’s $85,000 a year (p. 88) ÷ 460 students = $185 per student × 426 students. FY2026 vendor payments were $49,875 (about $108 per student) |
| Work visas | $12,500 | $11,100 | The district’s $14,000 estimate for 2026–27 (p. 88), scaled to the program’s size: about $1,474 per Mandarin-teaching FTE × 8.5 |
| Teacher stipends | $0 in both options (unconfirmed) | $0 at base: the district lists the additional 3% teacher salary ($50,000) among the reductions in effect for 2026–27 (p. 5). High case: two stipends per grade pair | |
| Substitutes, onboarding, upkeep | $3,200 | $2,700 | The district’s $3,600 for conference substitutes (p. 88), spread over the 8 grade pairs of 2026–27: $450 per pair × 7 |
| Total | $763,500 | $707,300 | Continue ≈ $1,792 per student (426 students); sunsetting ≈ $1,861 per student (380 students) |
Per student in 2027–28: continuing the full program is about $1,792 at base settings (range across all our low-to-high scenarios: $140–$3,300); sunsetting is about $1,861. The aide and coaching lines are $0 because the district lists both among reductions already in effect for 2026–27 (p. 5); the dean line is $0 at base and unconfirmed; see the notes below.
Download this table as an image (PNG, for sharing)
Where the numbers come from
- Blue Valley Schools, “K-8 Chinese Immersion Data & Information,” October 2026 (the district’s own document): the program’s annual cost by line (p. 88), the 2026–27 reductions already made (p. 5), enrollment by grade for 2017–2026 (pp. 90–91) and first-year savings by option (p. 93). 1
- Blue Valley 2026–27 Budget at a Glance, p. 12: average teacher pay $85,732 (includes benefits). We add 7.65% payroll tax on wages → $91,477 per teacher. 7
- 2023 Chinese Advisory Task Force report, pp. 11–12 (district): 2022–23 actual costs used only for the high cases (consultant, stipends, substitutes, upkeep). 3
- District claims report, June 30, 2026 (Board agenda): $49,875 paid for Mandarin Matrix and Level Chinese, the basis of our low materials case. 6
- HR addenda, Sep 8 and Oct 13, 2025 (Board agendas): 13 Chinese immersion teacher stipends in 2025–26 (none listed in any 2026 HR report through Oct 12, 2026); the high case restores them. 25 26
- Posted Wolf Springs Elementary class-size list, 2026–27 (unofficial; names withheld): the regular classes used for the whole-classroom count. 4
- Parent reports and a room-parent email (unverified; names withheld): no Chinese-immersion-specific aides in 2026–27; a September 2025 room-parent email listed a Mandarin aide in the 2025–26 kindergarten pair. 27 28
- Board meeting, Apr 13, 2026, and HR report, Sep 14, 2026: the superintendent renamed the administrative intern role “dean”; the 2026–27 HR report lists it as a teacher supplemental (14 extended days plus a supervisory stipend) at six elementary schools. 29 30
- KCTV5, Oct 14, 2026: the superintendent said the program has a dean most buildings do not. 2
Our assumptions
- Both columns are the added cost compared with ending the program after 2026–27, in 2027–28. “Continue” adds a new kindergarten class of 46 (the size of this fall’s class, W429 p. 90) in 2027–28; “sunset” means every enrolled student finishes and no new kindergarten class enters.
- Our provisional planning estimate of the added cost of continuing the full program in 2027–28, in today’s dollars and before raises, is $763,500. This is the added cost to the district, not necessarily what the district would ask families to raise. Why it depends on who stays: these figures are the district's cost with the program minus its cost without the program, serving the same students under the stated placement assumptions. If the program ends, it saves less when immersion students stay at Wolf Springs (they still need teachers) and more when they leave. Our base estimate assumes about half of immersion students stay.
- About half of immersion students would stay at their current school if the program ended. If staffing remains the same, as KCTV5 reported the superintendent saying it would if parents choose to stay, the two teacher lines drop to $0 and the continue total is about $169,400. 2
- The stipend, aide, consultant, coaching and dean lines are $0 at base. The district lists the 3% teacher salary, Chinese para support and the Chinese Immersion coach among the reductions in effect for 2026–27 (p. 5), and its list of current costs (p. 88) names no consultant or dean. 1 Our high case restores them.
- The instructional support staff line carries the district’s $75,000 in full so the estimate does not understate. The district describes it as a portion of an instructional coach and the district world language coordinator; these positions may continue regardless of the program (the coordinator’s role covers “all K–12 world languages,” p. 7), so this line may not be an avoidable cost. 1
- Regular classes at Wolf Springs are the 2026–27 posted list, moved up one grade each year; a regular kindergarten that starts after 2026–27 is assumed to have 41 students (this year’s count), and no attrition is applied to regular classes. These are projections, to be replaced with district projections. 4
- All figures are in today’s (2026–27) dollars. District figures are used as published; 2022–23 costs appear only in the high cases and are converted once, at 3% a year over four years (our assumption); nothing grows after 2026–27. Figures use current district pay and costs; they do not assume further district budget cuts. Enrollment starts from the district’s fall 2026 counts (pp. 90–91). Cohorts shrink at the rates the district’s own history shows: 5% a year at Wolf Springs Elementary, 10% at Valley Park, 92% of fifth graders take Chinese Language Arts in sixth, then 5% and 3%; each new kindergarten class is 46. At Wolf Springs we count whole classrooms (the way the district staffs); Valley Park, with no regular-class list, keeps the class-size-ratio estimate. When some students stay and some leave, the cost is still adjusted in proportion. The earlier, more cautious rule (the higher of the two methods in each grade) is $804,005 for continuing and $747,842 for sunsetting in 2027–28. 1
- Range across our low-to-high scenarios for continuing, per student: about $140–$3,300 in 2027–28 (this table's year). Averaged over all eight years (2027–28 through 2034–35, the table under “Best case to worst case over eight years”), the same scenarios give about $150–$3,400.
Documented
At the April 13, 2026 Board meeting the superintendent announced that the Wolf Springs Elementary administrative intern role would be called "the administrative dean, um, formerly known as the administrative intern. So, we'll be calling them our deans moving forward." The September 14, 2026 HR report lists the Wolf Springs dean as a teacher supplemental contract ("14 EXTENDED DAYS-ADMIN DEAN" plus an "ADMIN DEAN SUPV STIPEND"), and lists the same role at five other elementary schools (Timber Creek, Overland Trail, Leawood, Valley Park and Oak Hill). Wolf Springs also had an administrative intern in 2025–26. We found no public document that ties the Wolf Springs dean to the immersion program, and the stipend amount is not published. KCTV5 reports the superintendent saying the program "includes a dean, which most other buildings do not have." The supplements are confirmed; whether any salary cost of the role ends with the program is not confirmed, and the district's own list of the program's annual costs (p. 88) has no dean line. Our cost model counts the dean at $0 at base, with an unverified high case of about $8,700 (14 extended days at the teacher daily rate plus an estimated stipend). 29 30 2 1
Documented
The November 13, 2023 task-force proposal introduced a bilingual instructional design coach position for the immersion teachers. The September 8, 2025 HR addendum lists a Chinese-side coach supplemental ("16 EXTENDED DAYS-IDC") at Wolf Springs and Valley Park Elementary for 2025–26. The September 14, 2026 HR report lists no Chinese-specific coach supplemental for 2026–27, only the general Wolf Springs coach, and the district's October 2026 document lists the "Chinese Immersion Instructional Design Coach (IDC)," $90,000, among the reductions that "went into effect for the 2026-27 school year." A parent reports that the former Chinese-side coach is teaching in the program this year (parent report, unverified). Our cost model counts the Chinese-side coaching line at $0 at base, with an unverified high case of about $7,400 (16 extended days at the teacher daily rate). 24 26 30 1 27
Illustration: nine average positions
- Nine positions at the all-in average: $771,588 a year (9 × $85,732). With payroll tax on wages at the BASE teacher cost of $91,477: $823,293 (about $823,300).
- This is an illustrative gross cost before reassignment or attrition. It is not an upper bound and not a district savings estimate.
- Actual positions vary in salary and step and could cost more or less. A teacher reassigned into a needed position keeps a payroll cost but may avoid an outside hire (a saving, counted once and only if verified). Separation and transition costs are excluded. KCTV5 reported positions, not dollars. 7 2
Every input
Values are shown as low / base / high where they differ. “Sourced” means copied from a cited public document; “derived” is arithmetic on sourced numbers; “estimate” is a labeled parent assumption; “illustrative” is a placeholder that shows the arithmetic; “unverified” is a figure with no public amount behind it.
district_excess_cost_2627sourced
District's stated annual cost of the K–8 Chinese programs beyond a traditional classroom, 2026–27: 1,257,600 USD/yr
1 p.88 ('ANNUAL TOTAL $1,257,600'): additional K–8 staffing $1,080,000; instructional resources $85,000; instructional support staff $75,000 ('Portion of Instructional Coach & District World Language Coordinator salary and benefits'); additional substitute teacher costs for conferences $3,600; immigration & visa sponsorship fees $14,000 ('This is an estimate. Actual costs vary greatly based on individual circumstances.'). The district says these are 'annual estimates based on historical costs' that 'are current and do not assume increases due to inflation', that the staffing estimate 'includes an average salary, payroll taxes and district-paid benefits', and that 'if all students in the program attended their home school, this cost would not be incurred by the district' (p.88). The worksheet behind the lines is not published.
district_staffing_2627sourced
District's 'Additional K–8 Staffing' line, 2026–27: 1,080,000 USD/yr
1 p.88 About 11.8 teacher FTE at the BASE teacher cost (1,080,000 / 91,477). The number of positions is not stated.
district_students_2627derived
Students in Chinese immersion (K–5) and Chinese Language Arts (6–8), fall 2026: 460 students
1 pp.90–91 (beginning-of-year counts): Wolf Springs Elementary and Valley Park 278 + Wolf Springs Middle and Overland Trail Middle 182 Used to express the district's $1,257,600 per student and to scale the materials line.
district_savings_hs_only_yr1sourced
District's estimated savings (not labeled first-year), the option selected (Chinese at the high school level only): 1,230,000 USD
1 p.93: 'Ultimately, the decision to transition Chinese programming to the high school level only was selected for an estimated $1.23 million in savings.' Rounded as printed. Assumes the staffing line is largely removed in 2027–28; p.89 says transfer students 'may remain at their current school' and 'the full financial impact may not be realized immediately'.
district_savings_phase_out_cla_yr1sourced
District's estimated first-year savings, phase out CLA 6–8 and discontinue elementary programming (not selected): 1,100,000 USD
1 p.93 'an estimated $1.1 million in savings in the first year and additional savings in the subsequent years'.
district_savings_special_option_yr1sourced
District's estimated first-year savings, a Chinese special option at elementary and phase out of middle-school CLA (not selected): 1,000,000 USD
1 p.93 'an estimated $1 million savings in the first year and additional savings in the subsequent years'.
district_savings_sunset_yr1sourced
District's estimated first-year savings, sunset the elementary immersion and middle-school CLA programs (not selected): 360,000 USD
1 p.93: 'Sunset the elementary immersion and middle school CLA programs. This would have resulted in an estimated $360,000 in savings in the first year and additional savings in the subsequent years.' Our subtraction of two printed district figures, $1,230,000 - $360,000 = $870,000 (the $360,000 is labeled first-year; the $1.23 million is not), is the year-one difference if both are first-year.
district_net_section_factorderived
Net share of closed immersion sections that the district's 2022 worksheet counts as saved staffing (sections closed, net of sections added at receiving schools): 0.6364 share
1 pp.24–29 ('Net Effect of Immersion Participant Migration', 10/19/2022): if every immersion student returned to the home school, 22 immersion sections close (Valley Park 10, Wolf Springs 12) and the district's net change is -14 sections, because 8 sections are added at non-immersion sections. 14 / 22 = 0.6364. Applied here to the 2026–27 and later section counts to show the district method applied to our cohorts. It is the district's 2022 worksheet ratio, not a 2026 worksheet; the 2026 worksheet behind the $1,080,000 is not published.
gf_budget_2627sourced
General Fund, amount budgeted 2026–27: 200,590,299 USD
7 printed p.8 (Sources of Revenue and Proposed Budget, General) Fund 06 only; includes transfers out. Comparator, not money available for any use.
gsg_exp_2627sourced
General + Supplemental General expenditures, 2026–27 budget: 180,670,569 USD
7 printed p.6 Operating comparator.
per_pupil_gsg_2627sourced
General + Supplemental General expenditure per pupil, 2026–27 budget: 8,354 USD/pupil
7 printed p.6 ('Amount per Pupil') Used ONLY to express a cost as an equivalent number of pupils at current average spending; an expenditure figure, not state aid per pupil and not the marginal funding lost when one pupil leaves.
sped_transfer_2026sourced
District-stated general-fund transfer to cover special-education shortfall, 2026 projection: 18,000,000 USD
16 ('projected to increase to $18 million for 2026') The only district shortfall-type figure found. It is NOT a total budget shortfall and NOT linked by the district to Chinese.
projected_deficit_2627sourced
District's projected deficit (shortfall comparator): 4,000,000 USD
20 district budget video Oct 9, 2026 [06:46] 'We're projecting approximately a $4 million deficit.' District's own spoken projection, after ~$6M of reductions and ~$12M of reserves used to close FY2026. Year not stated precisely; treated as 2026–27.
gap_2627_marchsourced
Superintendent's 2026–27 gap statement (March): 10,000,000 USD
31 Board meeting Mar 9, 2026 [00:34:56] 'a gap of $10 million this year' Earlier figure, before reductions; shown for context.
operating_reserves_0701_2026sourced
Operating reserves (highlighted funds), July 1, 2026: 25,906,319 USD
32 2026–27 Budget Publication p.4 (9.69%; $38,680,032 / 15.05% on July 1, 2025) Context only.
contingency_reserve_0701_2026sourced
Contingency reserve fund (53), July 1, 2026: 14,889,000 USD
32 2026–27 Budget Publication p.4 Restricted-purpose fund; context only.
teacher_avg_allin_2627sourced
District 2026–27 contracted average, full-time teachers (all-in: salary + supplemental/extra pay + board-paid fringe; NO payroll tax): 85,732 USD/FTE
7 printed p.12: 2026–27 contracted average $85,732 (1,633.0 FTE, $140,000,000). The KSDE form defines Total Salary as including employee reduction plans, supplemental, extra pay for summer school, and board-paid fringe benefits (group life, group health, disability, AD&D, hospital/surgical/medical insurance), and says it does NOT include social security, workers' compensation or unemployment insurance. Because the figure already contains fringe and supplemental pay, no fringe or supplemental amount is added on top (no double counting). The 2026–27 component split is not published.
ksde_salary_2526sourced
KSDE 2025–26 average teacher base salary, USD 229: 72,488 USD/FTE
21 (report 20, 2025–26) Component split used only to estimate the fringe share.
ksde_supplemental_2526sourced
KSDE 2025–26 average supplemental pay, USD 229: 3,681 USD/FTE
21 (report 20, 2025–26) Treated as taxable wages (FICA applies).
ksde_fringe_2526sourced
KSDE 2025–26 average board-paid fringe, USD 229: 10,790 USD/FTE
21 (report 20, 2025–26) Insurance-type benefits; NOT subject to FICA.
ksde_total_2526sourced
KSDE 2025–26 average total, USD 229 (as printed): 86,960 USD/FTE
21 (report 20, 2025–26) Components sum to $86,959; $1 rounding in the source.
fringe_shareestimate
Fringe share of the all-in teacher average: 0.1241 share
Derived: 10,790 / 86,960 from 21 2025–26, carried to 2026–27 Estimate: assumes the 2026–27 split matches 2025–26. Also applied, as a stand-in, to the administrator and classified averages (7 p.12), whose splits are not published.
fica_ratesourced
Employer payroll tax (Social Security 6.2% + Medicare 1.45%): 0.0765 share of wages
Federal statutory rate Applied to the wage part only (all-in x (1 - fringe_share)).
wc_ui_rateestimate
Workers' compensation + unemployment insurance load (HIGH only): 0 / 0 / 0.02 share of wages
No public figure Applied to the wage part only.
teacher_costderived
Cost per teacher FTE used in the model: 85,732 / 91,477 / 92,978 USD/FTE
Formula: LOW = all-in average. BASE = all-in + fica_rate x all-in x (1 - fringe_share). HIGH = BASE + wc_ui_rate x all-in x (1 - fringe_share). Inputs: teacher_avg_allin_2627, fringe_share, fica_rate, wc_ui_rate. LOW omits payroll tax. FICA is charged only on the salary-and-supplemental part, not on board-paid insurance. KPERS employer share is a state pass-through for school employees and is excluded. Actual Chinese-side teachers may sit above or below the district average (records needed: FIN03).
stay_shareestimate
Blended share of all modeled immersion students assumed to stay at their current school if the program ends (displacement weight): 1.0 / 0.5 / 0.0 0–1
2 (KCTV5, secondary): superintendent said cancelling 'cutting the program would save nine teacher positions if students returned to their neighborhood schools' (KCTV5 paraphrase) and that if parents choose to stay at their current schools, staffing would remain the same (reporter's paraphrase, not a quotation). 33 Q6 lets transfer students stay for 2027–28. KEY SCENARIO PARAMETER, used as three discrete assumption scenarios (all stay / about half / most leave), NOT a per-student rate for any one child and not a confidence bound. The code applies this one weight uniformly to every modeled student at every site and grade (a linear, fractional credit); it is not the share of transfer students who stay, because the model has no split between students who already attend their home school and transfer families (the district's 2022 model kept 94 of 283 Wolf Springs immersion students at Wolf Springs, 1 p.29). Real staffing changes in whole sections and the district has published no section counts. Children who stay still need classroom teachers, so a Chinese-side teacher replaces a teacher the district needs anyway; children who return home are absorbed elsewhere and the position can be cut. LOW 100% stay, BASE 50%, HIGH 0%. The placement-form totals would settle a key input (request aggregate counts); staffing schedules and receiving-school capacity are also needed, and district section counts (FIN03, FIN05) would replace this assumption.
displacement_basis_ptrestimate
How much staffing staying children need: 0 = all current positions (district statement); 1 = Board PTR-matched need: 0 / 1 / 1 flag
LOW, and the separate 'all stay, staffing unchanged' scenario, follow KCTV5's report that the superintendent said staffing would remain the same if parents choose to stay (2). BASE/HIGH use district class size guidelines targets (3 p.11), which treat small cohorts (e.g., VPE ~33) as needing less than a full second teacher. Irrelevant when stay_share = 0. The first staffing scenario (all stay, staffing unchanged) sets this to 0 with all else at BASE; the other scenarios use the BASE value of 1.
stipends_per_duosourced
Program stipends (supplemental contracts) per elementary teaching pair: 0 / 0 / 2 stipends/duo
LOW and BASE = 0: the district lists 'Additional 3% Salary for Teachers, $50,000' among the reductions that 'went into effect for the 2026–27 school year' (1 p.5). HIGH = both co-teachers of a pair (3 p.11), kept as a sensitivity. For 2025–26, 13 'ADDL TEACHING CI-YEAR' supplementals were listed (26, 25) / 9 site-grades = 1.44 per pair. 'CI' is undefined in the HR reports and amounts are not printed; none is listed in any 2026 HR report through Oct 12, 2026. The HIGH case restores them.
stipend_per_teacherderived
Program-teacher stipend amount: 2,040 / 2,296 / 2,296 USD/stipend-yr
3 p.11: average $2,040 per teacher, 2022–23 actual BASE/HIGH escalated 3%/yr to 2026–27 (estimate). Whether stipends still exist in 2026–27 is unknown.
para_rule_weightestimate
Weight on paras required by the 2023 rule (para when an immersion class exceeds Board PTR): 1 / 1 / 0 0–1
24: 'Para professionals would be hired when classes exceed Board-established pupil-to-teacher ratios.' LOW and BASE apply the adopted 2023 rule (no paras while classes are at or under the ratio). HIGH uses the pre-2023 design instead (next row). Paras per pair are the larger of this rule and the per-pair row below.
paras_per_duosourced
Mandarin aides per elementary grade-level teaching pair: if each grade pair had a program aide (the district lists this support as cut for 2026–27): 0 / 0 / 1 paras/duo
BASE = 0. The district lists 'Chinese Para Support, $654,000' among the reductions that 'went into effect for the 2026–27 school year' (1 p.5). Parents also report no Chinese-immersion-specific paraeducators in 2026–27 (parent report, Oct 16, 2026, unverified; 27). HIGH = 1 per pair, the earlier allowance (a room-parent email of Sept 2025, 28, listed a Mandarin para in the 2025–26 kindergarten pair), kept so the sensitivity still exists; it is not the case in 2026–27. Counted per pair; where the 2023 rule adds more, the larger number is used, not both.
para_costderived
Cost per paraeducator position: 23,182 / 26,091 / 37,768 USD/position
LOW: 3 p.11 $510,000 / 22 paras (2 per site-grade x 11 site-grades in 2022–23). HIGH: 7 p.12 classified average $56,634 per 2,080-hr FTE x 1,300 school-year hrs (estimate), plus FICA on the wage part only (fringe share as teacher_avg estimate). BASE = LOW escalated 3%/yr for 4 yrs (estimate). Reading '$510,000 for two paras per grade level' as 22 positions is an interpretation.
consultant_prorataestimate
Chinese-speaking consultant, cost scaled by share of 2026–27 elementary site-grades still running: 0 / 0 / 0 USD/yr at full scale
3 p.11: $46,800 actual, 2022–23. BASE = 0 because the district's own list of current costs (1 p.88) names no consultant. Whether a consultant contract exists in 2026–27 is not stated; the district's p.88 list has none. HIGH is carried in consultant_fixed.
consultant_fixedestimate
Chinese-speaking consultant, full cost while any elementary immersion runs: 0 / 0 / 52,673 USD/yr
3 p.11 ($46,800 actual, 2022–23, converted to 2026–27 dollars) HIGH only. Not in the district's p.88 list.
idc_proratasourced
Chinese-side instructional design coach supplemental, scaled by share of 2026–27 elementary site-grades: 0 / 0 / 0 USD/yr at full scale
1 p.5: 'Chinese Immersion Instructional Design Coach (IDC), $90,000' is among the reductions that 'went into effect for the 2026–27 school year'. 26 (HR addendum, Sep 8, 2025): a Chinese-side coach supplemental '16 EXTENDED DAYS-IDC' at WSE and VPE in 2025–26. 30 (HR report, Sep 14, 2026): no Chinese-specific coach supplemental listed for 2026–27, only the general WSE coach. 24 (Nov 13, 2023): proposed a bilingual coach for the program. LOW = BASE = 0 because the district lists this coach as a 2026–27 reduction (1 p.5). A parent reports the former Chinese-side coach is teaching in the program this year (27); that salary is a teaching position, not an added coaching cost. HIGH is carried in idc_fixed.
idc_fixedunverified
Chinese-side instructional design coach supplemental, full while any elementary immersion runs: 0 / 0 / 7,375 USD/yr
26; 30; 34; 7 p.12 HIGH = the prior supplemental restored: 16 extended days x the teacher daily rate (all-in teacher average $85,732 / 186 contract days = $461; no payroll tax added). 186 days is the state minimum school year 34 and an assumption for the contract year; a coach's actual daily rate is not public.
dean_prorataunverified
Dean supplemental, scaled by share of 2026–27 elementary site-grades still running: 0 / 0 / 0 USD/yr at full scale
29 (Board meeting, Apr 13, 2026): the superintendent said the administrative intern role is now called 'dean'. 30 (HR report, Sep 14, 2026): the dean is a teacher supplemental ('14 EXTENDED DAYS-ADMIN DEAN' plus 'ADMIN DEAN SUPV STIPEND') listed at six elementary schools, not only the immersion school. 2 (KCTV5): the superintendent said the program 'includes a dean, which most other buildings do not have'. LOW = BASE = 0 (unconfirmed) because the role exists at six elementary schools and no public document ties it to immersion. The supplements are confirmed; whether any salary cost of the role ends with the program is not confirmed. HIGH is carried in dean_fixed. Replaces the earlier administrator-salary basis.
dean_fixedunverified
Dean supplemental, full cost while any elementary immersion runs: 0 / 0 / 8,749 USD/yr
29; 30; 34; 2 HIGH = 14 extended days x the teacher daily rate ($85,732 / 186 contract days = $461, an assumption; no payroll tax added) + a supervisory stipend of $2,296 (UNVERIFIED stand-in: the model's 2026–27 program-stipend amount; the actual stipend is not public).
support_staff_fixedsourced
Instructional support staff: portion of an instructional coach and the district world language coordinator (district allocation), while any elementary immersion runs: 0 / 75,000 / 75,000 USD/yr
1 p.88: 'Instructional Support Staff, $75,000 (Portion of Instructional Coach & District World Language Coordinator salary and benefits)'. BASE = the district's figure, so the estimate does not understate. It is an allocation of K–12 roles that may continue regardless of the program (the coordinator leads all K–12 world languages and high-school Chinese continues; the elementary coach is a general building position), so this line may not be an avoidable cost. LOW = 0 shows that case. Counted in full while any elementary immersion runs.
visa_per_ftederived
Work-authorization cost per Mandarin-teaching FTE per year (LOW and BASE set so the 2026–27 program-wide total is the district's $14,000): 1473.68 / 1473.68 / 5,000 USD/FTE-yr
LOW and BASE: the district's 'Immigration & Visa Sponsorship Fees, $14,000' for 2026–27 (1 p.88; 'This is an estimate. Actual costs vary greatly based on individual circumstances.') divided by the 2026–27 Mandarin-teaching FTE in this model. HIGH: our earlier basis, 3 p.11: '$15,000 per three years for one visa' for '>80%' of teachers, rounded up (all teachers, $5,000 per FTE). 35: 16 of 27 Mandarin-speaking teachers/paras in immigration process. The September 2022 evaluation reproduced in 1 p.10 budgeted $144,800 a year (visa sponsorship of $14,000 per three years, estimated at $44,800 a year, plus an attorney-fee estimate of $100,000 a year) for a fully built program; the district's 2026 figure is lower. HIGH keeps our earlier, higher basis.
materials_per_studentderived
Mandarin materials per participating student: 108.424 / 184.783 / 184.783 USD/student-yr
BASE and HIGH: the district's 'Instructional Resources, $85,000' a year (1 p.88) / 460 students (1 pp.90–91) = $184.78 per student. LOW: the FY2026 vendor claims, Mandarin Matrix $32,620 + Level Chinese $17,255 = $49,875 (June 30, 2026 claims report, 6) / 460 students = $108.42. The district's figure is about 70% more than the $49,875 paid to two Mandarin curriculum vendors in the June 30, 2026 claims report (6); the district has not itemized the difference. It is also above the $58,450 full-build figure in the 2022 evaluation (1 p.10, 648 students). Its breakdown, and which fund pays, are not given, so we use it at BASE (never understating) and show the claims basis at LOW. Vendor payments are curriculum inputs, not savings (FIN07 and FIN08 ask for the contracts and the fund).
other_per_duoderived
Conference substitutes per elementary teaching pair (the district's program-wide $3,600 spread over the 8 pairs of 2026–27): 450 / 450 / 1,182 USD/duo-yr
LOW and BASE: 1 p.88 'Additional Substitute Teacher Costs for Conferences, $3,600' / 8 site-grades in 2026–27 = $450 per pair. Onboarding is 0: 'Training and Professional Learning, $6,500' is listed as a 2026–27 reduction (1 p.5). HIGH: 3 p.12 substitutes $6,600 + onboarding $4,950 (2022–23), / 11 site-grades, converted to 2026–27 dollars. Small.
maintenance_fixedsourced
Program maintenance (ACTFL travel) while elementary immersion runs: 0 / 0 / 3,000 USD/yr
3 p.12: $3,000 budgeted 2022–23. Not in the district's p.88 list, so LOW and BASE are 0; HIGH only.
ms_participationderived
Share of a cohort that moves from grade 5 into middle-school Chinese Language Arts (the 5 to 6 step): 0.92 share
1 pp.90–91: across both sites, 249 fifth graders became 231 sixth graders in the next fall's CLA counts (-7.2%, 7 transitions, fall 2022 to fall 2026), so 0.92. Cohorts already in grades 6–8 in 2026–27 start from the district's CLA enrollment counts, so no participation share is applied to them (1.0). After grade 6 the cohort loses 5% going to grade 7 and 3% going to grade 8 (attrition_ms_6to7, attrition_ms_7to8). Varied 80% / 100% in Sensitivity.
ms_max_sectionestimate
Maximum CLA section size: 30 students
No public figure Minimum one section per grade per site whenever any student is enrolled.
ms_regular_classestimate
Typical middle-school class size used for displacement: 28 students
No public figure (grade 4–5 Board PTR is 28, 3 p.11)
ms_sections_per_fteestimate
CLA sections taught per teacher FTE: 7 / 6 / 5 sections/FTE
No public figure Depends on the middle-school bell schedule (FIN05).
bridge_group_sizeestimate
Maximum bridge group size: 27 students
Half of the 54-student grade cap (24)
bridge_sessions_per_fteestimate
Daily 30–45 min Mandarin sessions per licensed bridge teacher: 8 / 7 / 5 groups/FTE
No public figure LOW ~30-min blocks; HIGH 45-min blocks plus prep/travel.
study_costestimate
One-time cost of a public program study (pause option): 0 / 25,000 / 75,000 USD
No public figure LOW = done by staff; HIGH = outside evaluator.
pause_yearsestimate
Length of pause (current cohorts continue, no new entry): 2 years
Parent proposal
attritionderived
Annual cohort attrition, Wolf Springs Elementary grades K–5: 0.05 share/yr
1 p.90 (beginning-of-year counts): pooled year-over-year change from one grade to the next within K–5 at Wolf Springs averaged -4.7% a year (35 grade-to-grade transitions, 2017–2026). Varied 2%–8% in Sensitivity (the Valley Park rate moves with it, 5 points higher). Applies to every elementary cohort from its 2026–27 count and to future kindergarten cohorts after they enter.
attrition_vpederived
Annual cohort attrition, Valley Park Elementary grades 4–5: 0.1 share/yr
1 p.91: pooled year-over-year change within K–5 at Valley Park averaged -10.6% a year (24 transitions, 2018–2026). Valley Park's last entering class was 2022–23 (36); two grades remain in 2026–27. Applies to the two remaining Valley Park elementary cohorts.
attrition_ms_6to7derived
Cohort attrition from grade 6 to grade 7 (middle-school CLA): 0.05 share/yr
1 pp.90–91: -5.3% across both sites excluding one outlier (Overland Trail Middle, 37 to 24, 2025 to 2026); -5.6% at Wolf Springs Middle.
attrition_ms_7to8derived
Cohort attrition from grade 7 to grade 8 (middle-school CLA): 0.03 share/yr
1 pp.90–91: -3.4% across both sites (3 transitions).
duo_capacitysourced
Students per elementary teaching pair (two classes): 54 students
24 '54 students per grade level per year'; 3 p.11: WSE K PTR 26.5 with 53 students and 2 teachers
new_k_cohort_sizeillustrative
Students in each NEW kindergarten cohort entering every year (Option 7, continue full program): 46 students/yr
Set equal to the fall 2026 kindergarten immersion enrollment of 46 at Wolf Springs Elementary (1 p.90). WSE only: VPE's last entering class was 2022–23 (36). Earlier entering classes were 53–56 (2018–2023) and 35 and 37 (2024, 2025). Future enrollment demand is UNKNOWN (FIN04). Applies only to Option 7; the same size is used for every future entering year and the same attrition applies afterward. Varied 35 / 54 in Sensitivity. Replace with the district's enrollment and application counts.
transition_one_timeillustrative
One-time transition cost (memo; every option incurs one when its program ends): 0 / 50,000 / 150,000 USD
Same illustrative values as the research workbook (the illustration table under “How net savings should be measured” on this page, ILL-01 to ILL-05) Not netted: cancellation incurs it in 2027–28; sunset options defer it. Timing only.
board_ptr_targetssourced
District class size guidelines (pupil-to-teacher) by grade (K–5): K: 23.0 · 1: 24.0 · 2: 25.0 · 3: 27.0 · 4: 28.0 · 5: 28.0 students/teacher
3 p.11 'Target PTR' K 23, 1 24, 2 25, 3 27, 4 28, 5 28 (2022–23)
cohorts_2026_27sourced
Students enrolled by grade and site in fall 2026 (14 cohorts, total 460): 460 in 14 cohorts (grade-by-grade table below) students
1 pp.90–91: the district's beginning-of-year enrollment in Chinese immersion (Wolf Springs Elementary K–5, Valley Park 4–5) and Chinese Language Arts (Wolf Springs Middle and Overland Trail Middle 6–8), fall 2026. District counts, not estimates. Grades 6–8 are CLA enrollment. The unofficial posted Wolf Springs class list (4) is now used only for the regular (non-immersion) homerooms in the whole-classroom check.
Enrollment by cohort
The district’s own fall 2026 counts: Wolf Springs Elementary immersion and Wolf Springs Middle Chinese Language Arts (p. 90), Valley Park immersion and Overland Trail Middle Chinese Language Arts (p. 91). Grades 6–8 are Chinese Language Arts enrollment. 1
| Grade in fall 2026 | Elementary site | Middle school | Students | Basis |
|---|---|---|---|---|
| 8 | WSE | WSMS | 38 | District enrollment, Wolf Springs Elementary immersion / Wolf Springs Middle CLA, fall 2026 (1 p.90) |
| 8 | VPE | OTMS | 21 | District enrollment, Valley Park immersion / Overland Trail Middle CLA, fall 2026 (1 p.91) |
| 7 | WSE | WSMS | 36 | District enrollment, Wolf Springs Elementary immersion / Wolf Springs Middle CLA, fall 2026 (1 p.90) |
| 7 | VPE | OTMS | 24 | District enrollment, Valley Park immersion / Overland Trail Middle CLA, fall 2026 (1 p.91) |
| 6 | WSE | WSMS | 41 | District enrollment, Wolf Springs Elementary immersion / Wolf Springs Middle CLA, fall 2026 (1 p.90) |
| 6 | VPE | OTMS | 22 | District enrollment, Valley Park immersion / Overland Trail Middle CLA, fall 2026 (1 p.91) |
| 5 | WSE | WSMS | 38 | District enrollment, Wolf Springs Elementary immersion / Wolf Springs Middle CLA, fall 2026 (1 p.90) |
| 5 | VPE | OTMS | 18 | District enrollment, Valley Park immersion / Overland Trail Middle CLA, fall 2026 (1 p.91) |
| 4 | WSE | WSMS | 43 | District enrollment, Wolf Springs Elementary immersion / Wolf Springs Middle CLA, fall 2026 (1 p.90) |
| 4 | VPE | OTMS | 20 | District enrollment, Valley Park immersion / Overland Trail Middle CLA, fall 2026 (1 p.91) |
| 3 | WSE | WSMS | 43 | District enrollment, Wolf Springs Elementary immersion / Wolf Springs Middle CLA, fall 2026 (1 p.90) |
| 2 | WSE | WSMS | 36 | District enrollment, Wolf Springs Elementary immersion / Wolf Springs Middle CLA, fall 2026 (1 p.90) |
| 1 | WSE | WSMS | 34 | District enrollment, Wolf Springs Elementary immersion / Wolf Springs Middle CLA, fall 2026 (1 p.90) |
| K | WSE | WSMS | 46 | District enrollment, Wolf Springs Elementary immersion / Wolf Springs Middle CLA, fall 2026 (1 p.90) |
| Total | 460 |
Wolf Springs Elementary, 2026–27, whole-classroom check from the unofficial posted class list. Needed = the grade total divided by the Board target, rounded up. This is the current-year check. For later years the regular classes on this list move up one grade each year (later kindergartens are assumed to be 41, with no attrition), and the model counts whole classrooms at Wolf Springs, as in the 2027–28 class-size table above. These are projections, to be replaced with district projections. 4
| Grade | Regular students | Immersion students | Grade total | Board target (students per teacher) | Homerooms now | Needed without immersion | Avoidable |
|---|---|---|---|---|---|---|---|
| K | 41 | 46 | 87 | 23 | 4 | 4 | 0 |
| 1 | 46 | 34 | 80 | 24 | 4 | 4 | 0 |
| 2 | 29 | 36 | 65 | 25 | 4 | 3 | 1 |
| 3 | 61 | 43 | 104 | 27 | 5 | 4 | 1 |
| 4 | 39 | 43 | 82 | 28 | 4 | 3 | 1 |
| 5 | 41 | 38 | 79 | 28 | 4 | 3 | 1 |
| Total | 257 | 240 | 497 | 25 | 21 | 4 |
Every formula
- Teacher cost. LOW = A. BASE = A + 0.0765 x A x (1 - f). HIGH = BASE + 0.02 x A x (1 - f). A = teacher_avg_allin_2627 ($85,732, already includes supplemental pay and board-paid insurance); f = fringe_share (10,790 / 86,960 = 0.1241). Payroll tax is charged only on the wage part A x (1 - f).
- Cohort size. From the district's fall-2026 count, each year up one grade: elementary grades lose the site's attrition (Wolf Springs 5%, Valley Park 10%); the step from grade 5 to grade 6 keeps 92%; grade 6 to 7 loses 5%; grade 7 to 8 loses 3%; rounded to whole students. Cohorts already in grades 6–8 start from CLA enrollment.
- Elementary teaching pairs. pairs = max(1, ceil(n / 54)) per cohort and year, for grades K–5 while the option runs elementary 50/50.
- Regular-teacher need. Valley Park: need = n / PTR(grade); matched = min(max(need - pairs, 0), pairs). Wolf Springs: matched = pairs - rooms freed, where rooms freed = min(max(rooms with immersion - rooms without immersion, 0), pairs); rooms with immersion = 2 x pairs + regular homerooms, rooms without immersion = ceil((regular students + immersion students) / PTR(grade)), regular homerooms = ceil(regular students / PTR(grade)). Matched positions are Chinese-side teachers the same children would need anyway. The regular classes are the 2026–27 posted list moved up one grade each year (later kindergartens 41, no attrition). The cautious per-grade sensitivity takes, in each Wolf Springs grade, the smaller matched number of the class-size ratio and the whole-classroom count.
- Elementary teacher cost. (pairs - w x [p x matched + (1 - p) x pairs]) x teacher cost. w = stay_share scenario (1.0 / 0.5 / 0.0), a blended weight applied linearly to fractional positions for all modeled students; p = displacement_basis_ptr (0 LOW, 1 BASE/HIGH).
- Middle-school CLA sections. participants = the cohort's CLA enrollment (the 5 to 6 step already applies the 92% share); sections = max(1, ceil(participants / 30)); FTE = sections / sections_per_FTE.
- Middle-school teacher cost. (sections - w x [p x matched sections + (1 - p) x sections]) / sections_per_FTE x teacher cost. matched sections = sections x min(1, class size / 28).
- Bridge teachers. groups = max(1, ceil(n / 27)) per cohort; FTE = groups / sessions_per_FTE; cost = FTE x teacher cost.
- Stipends, paras, support. stipends = stipends_per_duo x pairs x stipend_per_teacher (0 at LOW and BASE: cut for 2026–27, 1 p.5); paras = max(para_rule_weight x rule paras, paras_per_duo x pairs) x para_cost (0 at BASE); consultant, coach and dean (supplemental pay: extended days at the teacher daily rate, plus the dean's stipend) = pro-rata x share of 2026–27 elementary site-grades still running + fixed x (running = 1/0) (all 0 at BASE); instructional support staff = support_staff_fixed ($75,000 at BASE, the district's p.88 allocation) x (any elementary immersion running = 1/0).
- Visas, materials, other. visa = visa_per_fte x (pairs + MS FTE + bridge FTE), set so 2026–27 is the district's $14,000; materials = materials_per_student ($85,000 / 460 at BASE) x all students served; other = other_per_duo ($3,600 / 8 pairs at BASE) x pairs + maintenance (HIGH only).
- District staffing method (preliminary extrapolation, not a forecast). Every student returns to the home school; both sides' immersion sections close, net of the regular sections added back at Wolf Springs and Valley Park for children who live there (in the 2022 worksheet, changes at the other elementary schools offset: five grade-level classrooms added and five removed, for zero net change; at the building-total level, three schools increased and three decreased): elementary FTE = 2 x pairs x district_net_section_factor (14 / 22, 1 pp.24–29); CLA FTE = sections / sections_per_FTE; cost = FTE x BASE teacher cost. The district's own $1,080,000 staffing line is about 11.8 FTE at our teacher cost of $91,477 (the district average plus payroll tax on the wage part); that is our division, not a district count. This case is a preliminary extrapolation of the district's 2022 method to current classes, not a forecast and not a claim about the district's $1.23 million: the district says transfer students may stay through graduation and 'the full financial impact may not be realized immediately' (1 p.89).
- Total and cumulative. Annual total = sum of the cost lines; cumulative = sum over2027–28 through 2034–35, constant 2026–27 dollars (no inflation).
- Comparators. Share of $4 million deficit = year-one cost / 4,000,000. % of General Fund = average annual cost / 200,590,299. Per student-year = cumulative / student-years served. Equivalent pupils at current average spending = average annual cost / 8,354 (a scale reference only; $8,354 is average spending per pupil, not the marginal funding lost when a pupil leaves).
- Nine positions (illustration). 9 x A = $771,588 (all-in) or 9 x BASE teacher cost. A gross illustration of nine average positions before reassignment or attrition; not a savings estimate.
- Keep the program (Option 7). Current cohorts as in Option 2, plus a new kindergarten cohort of new_k_cohort_size students (46) entering WSE every fall 2027–28 onward, each followed through K–5 and middle-school CLA with the same attrition. No end year. Cumulative 2027–28 through 2034–35 uses the same time horizon as the other options (not the same population, since new kindergarten cohorts are added). Continuation creates obligations beyond that period. The cost of the next school year (2027–28) is the same formulas evaluated for that year, for continuing the full program and for sunsetting; today's (2026–27) dollars.
- Staffing scenarios. Three discrete scenarios (all stay, about half stay, most leave). The only evidence is an aggregate statement (2). Section-level effects are stepwise and cannot be known without district section counts, so no per-family savings rate is computed or implied. The model itself applies the credit linearly to fractional positions; real staffing changes in whole positions at classroom thresholds. These are assumption scenarios, not confidence bounds. District staffing data (FIN03, FIN05) would replace them.
What would change these numbers
- How many immersion students stay at their current school. The placement-form counts decide this. 2 22
- Section schedules. For scale, the district's average elementary class size in 2024–25 was 21 (district-wide average, not immersion-specific). 37 Do immersion classes sit at Board ratios (then a Chinese-side teacher replaces a regular teacher the same children need anyway, so the incremental cost is near zero)? Or does cancellation let the district absorb these children into existing classes with spare seats? 3
- Future enrollment. The model starts from the district's fall 2026 counts and ages them at the rates its own history shows. Small cohorts (Valley Park's two remaining grades) cost more per student because a teaching pair is needed regardless; full 54-seat cohorts cost little more than regular classes. 1 24
- What is in the district's $85,000 for resources and $75,000 for support staff. The district lists paraeducators, the 3% stipend and the coach as 2026–27 reductions and names no consultant. 1
- Would the dean supplemental (14 extended days plus a supervisory stipend, amount not public) end with the program?
- Why is the Chinese-side coaching supplemental listed in 2025–26 not listed for 2026–27? 26 30
- Which fund pays for materials? 3 25 6
- Whether Chinese-side teachers would be reassigned into positions that would otherwise be filled by an outside hire (the avoided hire is a saving relative to continuing, term V in the net-savings formula, counted once and only if verified) or separated (saving, minus any separation and visa costs). The model does not value avoided outside hires, so it sets V to zero.
- The worksheets behind the district's savings figures. The right test: district savings for 2027–28 minus each option's cost in the same year. 1
- Not modeled: families leaving the district (the funding lost per departing pupil is not known; $8,354 is average general plus supplemental spending per pupil, a scale reference only, not lost marginal funding) and high-school Chinese viability. 7
The pending records requests ask for most of these records.
The 2023 cost table
Documented
The district's April 25, 2023 task-force data report lists $510,000 per year budgeted for regular and Chinese-speaking paraeducators, within a $752,790 "current additional program cost" estimate that mixes actual and budgeted 2022–23 figures (456 students). 3
Avoid / caution
The $510,000 and $752,790 figures are historical 2022–23 incremental costs. They are not current cancellation savings: the 2023 plan already changed staffing, regular classroom teaching continues after cancellation, and current accounts, reassigned positions and transition costs have not been published. 3 24
Program In-Excess Costs — Actual & Budgeted Expenditures 2022-23 3
| 2022–23 incremental item | Per year | Printed as |
|---|---|---|
| Program-teacher stipends | $39,340 | actual |
| Regular and Chinese-speaking paraeducators | $510,000 | budgeted |
| Chinese-speaking consultant | $46,800 | actual |
| Additional 0.5 FTE instructional-design coaching at each site | $72,000 | budgeted |
| Work authorization (visas) | $45,000 | budgeted |
| Mandarin resources (printed cost column) | $25,100 | budgeted |
| Conference substitutes | $6,600 | budgeted |
| Program onboarding / summer workshop | $4,950 | budgeted |
| Program maintenance / personnel investment | $3,000 | budgeted |
| Declared total | $752,790 | mixed |
- The nine printed rows add exactly to the declared $752,790: about $1,651 per student at 456 students.
- The report separately projects "nearly $1.1 million per year for a maximum of 648 students" at full build-out. That is a forecast, not an appropriation. 3
- The $510,000 line: the report says two paraeducators per grade level supported larger classes and kept Mandarin going when a Chinese-side teacher was absent. 3
- The adopted 2023 plan called for changing staffing: paraeducators hired when classes exceed Board-established pupil-to-teacher ratios, and a new bilingual Instructional Design Team position for the program. 24
Discrepancies in the source, kept as printed
- The Mandarin-resources row lists components totaling $58,450 ($27,500 + $25,600 + $350 + $5,000), but its cost column says $25,100. Only $25,100 makes the rows add to the declared total. The report does not explain the difference.
- The report gives 456 students at "76.8% capacity," but 456 ÷ 648 (the stated full-build target) is 70.4%. A 594-seat count (eleven current site-grade cohorts × 54) gives 76.8%. That is a plausible explanation, but the district has not confirmed it.
- The 648-seat target is labeled "Full K-6," but K–6 at 54 per grade at two sites would be 756 seats.
Budget background: deficit, reserves, sports, special-education funding, lawsuit, administrator pay
The pressure is real. The district's October 16 document says it expects about a $4 million shortfall this year, after more than $6.5 million in cuts made last year. 1 The district's own October 9 budget video and budget publication add: about $12 million of reserves used to close the 2026 fiscal year, and operating reserves down to 9.69% on July 1, 2026. None of these is Chinese-specific, and none is a savings estimate. 20 32
- The district's Oct. 9 budget video (quoted in the first finding below) described reductions of about $6 million at that time and "approximately a $4 million deficit" still projected. 20
- KCTV5 (Oct. 15) reported "district leaders say the program is one of several reductions needed to close a $10 million budget gap." 38 In March the superintendent had anticipated "a gap of $10 million this year." 31
- The $10 million and $4 million figures appear to describe the gap before and after this year's reductions. The district has not published a statement connecting them. 20 31 38
Documented
The district's own budget video of October 9, 2026 says the reductions made so far "got us to $6 million, but it's just not enough," that it used "close to $12 million" of operating reserves to close the 2026 fiscal year, and that it is "projecting approximately a $4 million deficit." Its 2026–27 budget publication shows the July 1 beginning balances of its highlighted funds falling from $38.7 million (15.05% of general plus local-option-budget spending) in 2025 to $25.9 million (9.69%) in 2026, including $14.9 million in contingency reserves; the contingency reserve is part of that total, not separate from it. These are fund balances, not money available for any one purpose: the total also includes restricted funds such as special education ($8.5 million), and the district's audit says remaining general-fund balances "should not be considered as additional resources." 20 32 37
Documented
The contingency reserve, $14,889,000 on July 1, 2026, is one potential one-time bridge for a continuation cost, subject to Board decision and budget constraints. It is not the only possible source: the general fund and local option budget are the ordinary operating bases from which instruction is funded, and the Board can reprioritize current-year spending within them. Their year-end balances are near zero by design ($252,048 and $668,888 at June 30, 2025), and the district's audit says those balances "should not be considered as additional resources," so a low balance shows the funds are fully budgeted, not that nothing can be reallocated. Current Kansas law sets no percentage cap on the contingency reserve and leaves "financial contingencies" to the Board. A reserve is one-time money and a program is a recurring cost, so a recurring continuation would still require an operating reallocation or recurring revenue. 32 37 39
What the Board record shows about the reductions
- In March 2026 the superintendent told the Board the district had "already made the reductions that we can" and that there is "not one program or one thing that we do that I can say yeah we don't really need that." The October 2026 document compares only Chinese options (p. 93); we have not located a published comparison with the district’s other reductions, and we ask the Board to publish one. 31 1 15
- A "three-phase approach to addressing the current budget deficit" was described to an advisory committee in February 2026. No itemized list of the phases or of the reductions appears in any Board packet we reviewed. The district’s October 16 document lists last year’s reductions by category, without amounts (18 items, including “Chinese immersion program staffing changes” and “District office staff reductions (9.5 FTE)”), and puts the total at “more than $6.5 million”; its October 16 update says “more than $6 million.” 40 20 1 15
- The legally required budget hearing on September 14, 2026 drew no public comment and included no program-level reduction list. 41
- Scale: the 2023 program-cost estimate equals about 0.27% of that year's operating spending; see administrator compensation below. 3 42
Budget at a Glance figures
These figures confirm enrollment pressure in general terms ( is a funding count). All-funds totals include restricted, capital and debt funds, so a large district-wide total does not mean the district can legally or sustainably spend the same dollars on this program. 7 37
District-wide figures from the 2026–27 Budget at a Glance. None of these is Chinese-specific or a savings estimate.
| District-wide (not Chinese-specific) | 2024–25 actual | 2025–26 actual | 2026–27 budget |
|---|---|---|---|
| All-funds total expenditures 7 | $402,931,947 | $427,821,611 | $461,684,860 |
| Current expenditures (excludes capital outlay and bond debt) 7 | $308,838,294 | $330,863,882 | $359,806,934 |
| General + supplemental general expenditures 7 | $170,885,173 | $178,675,522 | $180,670,569 |
Budget-aid FTE enrollment, excluding virtual 7. That is 279.6 FTE (about 1.28%) lower from 2023–24 actual to the 2026–27 budget. Aid FTE is a funding count, not a headcount of Chinese-program students.
| 2022–23 | 2023–24 | 2024–25 | 2025–26 | 2026–27 budget |
|---|---|---|---|---|
| 21,810.2 | 21,853.8 | 21,749.9 | 21,575.7 | 21,574.2 |
Sports and activities: what changed
- No sport cut found for 2026–27. The team lists we checked at one high school and one middle school name the same sports as a year earlier, though web lists can lag. 43 44
- Girls flag football was added, although April minutes expected budget pressure to limit new activities. 45 It is funded by "Kansas City Chiefs grants, community fundraising, SCHEELS, USA Football, and gate receipts." 46 30
- Fees went up. For 2026–27 the Board raised athletic passes to $60 student (was $40), $80 individual (was $55) and $250 family (was $85), and the high-school activity fee to $150 (was $135). 47 48 The whole fee package also covers lunch, parking, bus and device fees; its combined budget impact was estimated to exceed about $500,000. 29 47
- A subsidy remains. On April 13 a staff member gave a rough verbal estimate of "about 400,000" in general-fund support for athletics and activities beyond pass revenue. 29
- No published total. We have not located a district figure for total athletics cost.
- Bond money is separate. The proposed 2027 bond includes $5.6 million for courts, tracks, turf and fitness equipment; voters have not approved it. District leaders said capital funds cannot be used for instruction. 49 50 2
Proposal
A fair ask
District staff gave a rough public number for the athletics subsidy; it can give the same kind of estimate for Chinese.
Avoid / caution
What not to claim
- "Athletics costs $X." No district total exists.
- That bond-funded turf could pay teachers.
- A sum of fee, general-fund and bond dollars; they are different kinds of money.
State special-education funding and the lawsuit
The district's FAQ names special-education underfunding as one reason for the change. Here is what the official state and district sources say. 33
Documented
Kansas law computes special-education state aid as 92% of statewide excess costs, but the amount is "subject to appropriation acts of the legislature." 51
Documented
Kansas law computes special-education state aid at 92% of statewide excess costs, "subject to appropriation acts of the legislature." For 2026–27, the Division of the Budget reports that the $617 million appropriated "will provide just 65.3 percent of school districts' special education excess costs." KSDE reports 71.6% for 2023–24 (actual). 51 52 53
Our reading
There is a competing calculation. The Kansas Policy Institute argues that the state's figure leaves out local option budget (LOB) money that special-education aid generates, and that counting it put funding above 92% in 2023–2025. That money is mostly local property tax, plus some state equalization aid. The statute's 92% refers to state aid, and the 2024 Legislature considered a version of the bill that would have counted LOB toward the 92% but did not enact it. Expect this argument; answer it by explaining what is being counted, not by disputing the arithmetic. 54 51 55 56
Documented
Blue Valley says that in 2025 "more than $16 million" was transferred from its general fund to cover the special-education funding shortfall, projected to rise to $18 million for 2026. 16 The district's October 16, 2026 update says it transferred $18.9 million "last year" from other district resources to cover the gap. 15
Blue Valley's $16 million and $18 million are the district's own figures for money moved from its general fund. They are not the same as a statewide "shortfall" computed under the statute; do not treat them as interchangeable. 16 51
Documented
The state's Budget Stabilization Fund (its rainy-day fund) is projected at nearly $2.0 billion by the end of FY 2027. This is separate from the State General Fund ending balance, projected at about $2.10 billion for FY 2026 and $1.55 billion for FY 2027 (the report prints the FY 2027 figure as both $1,554.4 million and $1,557.4 million). These are approved-budget projections, not year-end actuals. 52
Our reading
State special-education funding is a real pressure on the district's budget and a fair issue to raise with legislators. It does not, by itself, show how much ending Chinese saves or whether a current-cohort pathway is affordable. Those questions still need the district's own numbers. 16 33
State funding lawsuit: where it stands
- On May 20, 2026, Blue Valley, De Soto (USD 232), Olathe and Shawnee Mission announced a signed Memorandum of Understanding forming the Kansas Public Schools Funding Coalition. 57
- On Aug. 11, 2026, the coalition announced it had selected the law firm Lathrop GPM to advise on school finance, "evaluate the legal and strategic timing for litigation against the State of Kansas," and develop a litigation strategy. 58
- No lawsuit has been filed as of the sources below. KCUR (Aug. 12) reported the coalition "has not filed a suit." 59
- Board President Jan Kessinger told KCTV5 on Oct. 15: "Whether that's a lawsuit, that remains to be seen." 38
- Superintendent Gillian Chapman told BV Tiger News (a student newspaper, Sept. 25): "Collectively we'll be working together to determine if and when the time is right to file the lawsuit." 60
- The coalition says state law requires the state to fund special education at "92 percent of excess costs," that it has not done so "for more than 15 years," and that the four districts "collectively spent more than $119 million in local funds" in 2024–25 to cover the shortfall. 58 The statute itself is cited separately above. 51
- We found no Blue Valley Board agenda item or minutes recording a vote on the MOU or the counsel selection in BoardBook (May–Oct 2026). 61
- A lawsuit, if filed, would take time to resolve and would not by itself change the 2027–28 program decision. Restoring funding would still require Board action.
Administrator pay: details, raises table and administrative spending
Administrator raises compared with a typical U.S. raise and inflation
| School year | Board-approved administrator raise | Typical U.S. raise (WorldatWork) | Administrator raise vs typical | CPI-U (reference) | Source |
|---|---|---|---|---|---|
| 2021–22 | two-year contract approved; percentage not stated | 3.0% (2021) | not stated | +4.7% (2021) | 62 63 |
| 2022–23 | same two-year contract; percentage not stated | 4.1% (2022) | not stated | +8.0% (2022) | 62 63 |
| 2023–24 | 6% | 4.4% (2023) | above | +4.1% (2023) | 13 64 |
| 2024–25 | raise approved; percentage not published | 3.9% (2024) | not stated | +2.9% (2024) | 14 65 |
| 2025–26 | 4% | 3.7% (2025) | about at (slightly above) | +2.6% (2025) | 14 66 |
| 2026–27 | 0% (frozen) | 3.6% (2026, projected) | below | +3.7% (12 months to September 2026) | 15 66 |
The 2020–21 raise was not found (2020 U.S. typical raise: 2.9%) 67. WorldatWork figures are U.S. all-sector averages. CPI-U percentages are calendar-year changes, our calculation from BLS data. The cost per administrator position in KSDE totals rose faster than these raise percentages in several years because it also reflects benefit costs, steps and position mix.
Since the figures above
- For 2026–27 the district contracted $18,700,000 for 107.0 administrator FTE, which is $320,986 (1.7%) lower than 2025–26 (average per position $174,766, down 3.7%). The district's October 16, 2026 update says administrators received no salary increase for 2026–27 and reports about $1.5 million in staffing reductions that began at the district office, including eliminated deputy superintendent and assistant superintendent positions. 7 15
- The district's October 14, 2026 Board Brief reports that the Board approved a 1% compensation increase for classified staff and a 1% increase to the professional employee salary schedule for 2026–27; the 2025–26 increases were 4% for each of those groups, and administrators received none for 2026–27. 68 15 14
Documented
The Board approved a 6% administrator increase for 2023–24, an increase for 2024–25 (percentage not published), and an overall 4% increase for 2025–26, the same percentage it approved for classified staff and for each cell of the teacher salary schedule. For 2026–27 the district says administrators received no salary increase; the October 12, 2026 agenda lists teacher and classified compensation only. 13 14 15 69
How the inflation illustration works (our arithmetic, not district figures)
- The 2022–23 cost per administrator position ($149,653; $181,498 by 2025–26) is grown each year by the CPI-U calendar-year change (4.1% for 2023, 2.9% for 2024, 2.6% for 2025). The gap each year is the actual cost per position minus that path, times the actual positions (103.0, 103.9 and 104.8 FTE): about $0.34 million, $1.26 million and $1.78 million, $3.4 million in all. If cost per position had stayed completely flat at $149,653, the gaps would be about $1.0 million, $2.4 million and $3.3 million. For 2026–27, after the freeze, the gap against the 2026–27 contracted total ($18,700,000) is about $0.45–0.65 million.
- KSDE's totals include board-paid insurance and position mix, so cost per position is not a raise percentage. 5% of $18,700,000 is $935,000. The administrator total and the program's added cost are different accounts.
Context
- Teacher pay also rose over this period (KSDE average full-time teacher, $68,572 in 2022–23 to $84,948 in 2025–26). 12 7
- The Board sets administrator pay. Administrator contracts are not published, and many administrator salaries are set by fixed-term contracts (the prior superintendent's barred reductions during its term), so changes may take effect only at renewal. We have not seen the current contract terms. Criticize budget choices, not people. 17
- KSDE reports the 2025–26 contracted position total (salary, supplemental pay and board-paid benefits) at $380,201, second highest of 285 districts; the Kansas average on the same basis is $149,896 (about 2.5 times). 70 71
- Superintendent position, KSDE totals: $356,447 (2022–23), $377,987 (2023–24), $451,576 (2024–25, the state's highest that year and the prior superintendent's final year), $380,201 (2025–26, contracted). KSDE notes that totals can reflect factors such as severance packages. Olathe's 2025–26 total is $334,195; the highest in Kansas is $389,442 (Wichita). Individual cabinet salaries are not published. 70 71
- Blue Valley board members serve without pay: the district's board page says "All seven serve the entire district without pay." 72 A June 12, 2023 Policy 1300 review states members are not compensated other than reimbursement for out-of-pocket expenses and dues (the adoption vote was not located). 73 Kansas law changed in 2023 to allow school boards to pay members. 74
Administrative spending overall
Documented
On the state's comparable operating basis, general plus school administration was 6.29% of Blue Valley's operating spending in 2024–25 ($21,062,711 of $334,805,071), down from 6.62% in 2022–23: dollars rose, the share fell. The 2026–27 all-funds budget plans instruction at $233,076,934, up 9%, and "Administration & Support" at $38,991,000, down 4%. 75 42 7
Our readingConditional
Scale check, same year, arithmetic only: the district's 2023 estimate of the Chinese program's added cost, $752,790 for 2022–23, equals about 0.27% of that year's $280,877,433 operating spending and about 4% of general plus school administration. The two figures use different accounting, the $752,790 mixes actual and budgeted amounts, and neither is a current savings figure. 3 42
The administrator pay category and the state's administration functions overlap (principals' pay sits in both), so the two sets of figures must not be added together. 7 75
Administrator compensation and administrative spending. An independent review re-checked the public administrator-compensation figures against official state and district records. Only aggregate, position-level findings are published here. No individual's pay is listed, and no administrator salary is presented as an avoidable saving. The named-payroll material in the underlying research is not published.
Records we have asked for
- The Kansas Open Records Act gives access to existing records. It does not require the district to create a new analysis. 76
- Asking the administration to prepare a comparison is an advocacy request to the Board, not a records request.
- Parents have already requested most of the records below: records already requested.
The missing records, by category
- FIN01Current program accounts, actual spending and FTE by school, year, job category and funding source
- FIN02The 2027–28 cancellation baseline and annual net-savings model, with formulas
- FIN03Deidentified position-level elimination, attrition, reassignment and replacement mapping
- FIN04Aggregate applications, offers, enrollment, waitlist and withdrawals by grade and site
- FIN05Section schedules, bilingual and paraeducator allocations, vacancies and feasible staffing
- FIN06Transition dates, materials, contracts, transportation and course-placement costs
- FIN07The native 2023 cost model, final 2022–23 actuals and explanation of the discrepancies above
- FIN08Program revenues and restrictions, and any actual outside-support commitments
- FIN09Any existing grandfathering, clustering or bridge analyses, and rejected-option assumptions
- FIN10High-school section minimums, placement and credit rules after lower grades end